
June 11, 2025
How to Query Google Search Console Data in BigQuery?
Updated: June 11th, 2025
Google Search Console is one of the go-to tools for figuring out what content to create next. However, one major limitation is that the interface only displays the top 1,000 search queries, which can be quite restrictive when trying to get a comprehensive view of your site’s performance.
One workaround is using the Google Search Console API within Google Sheets, which lets you access up to 25,000 rows of data. But there’s an even more powerful option: connecting Google Search Console to BigQuery (BQ). This allows you to access all the raw data and run simple queries to analyze your search performance.
If this sounds useful, I’ll walk you through the exact steps to connect and query Google Search Console data in BigQuery and show you how to run your first few queries!

Table of Contents
Here’s what you will learn in this article
- Link Google Search Console to BigQuery
- Querying Google Search Console Data in BigQuery
- Query Recipes
- Final Words
Link Google Search Console to BigQuery
To get started, you’ll need to link your Google Search Console property to BigQuery. It’s important to note that data only begins exporting after the connection is created, so the sooner you set this up, the better!
If you prefer to follow along with a video, you can watch the entire setup process step-by-step on the Analytics Mania YouTube channel.
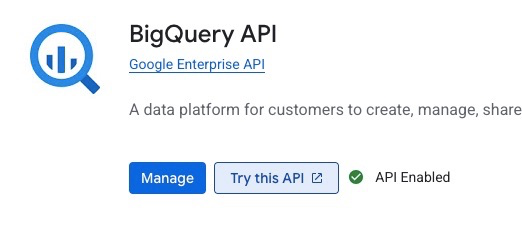
Start by opening the BigQuery console. Search for “BigQuery API”.
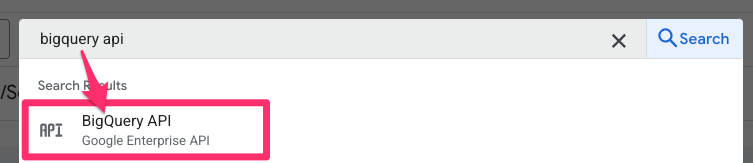
Enable the BigQuery API (I have already enabled this).
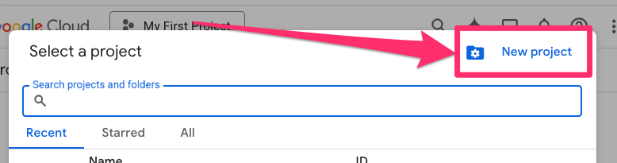
If you don’t already have a project set up, you’ll need to create one. Click the project picker, then select “New project.” Fill in the Project name with something like GSC BigQuery (you can include details about the specific site it’s for, too, if you have multiple), choose a billing account (or create one, if needed), and select an Organization, if required.
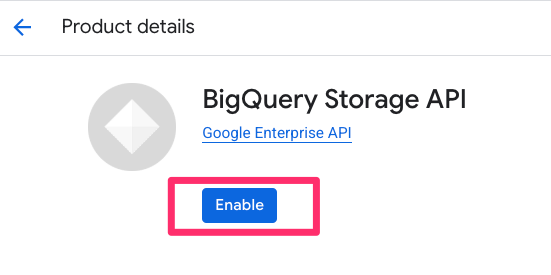
Next, search for “BigQuery Storage API”.
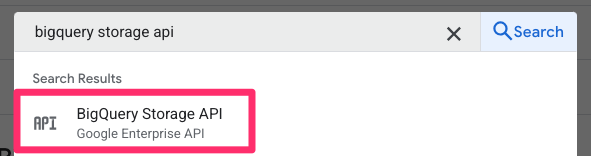
On this page, enable the API by clicking the “Enable” button.
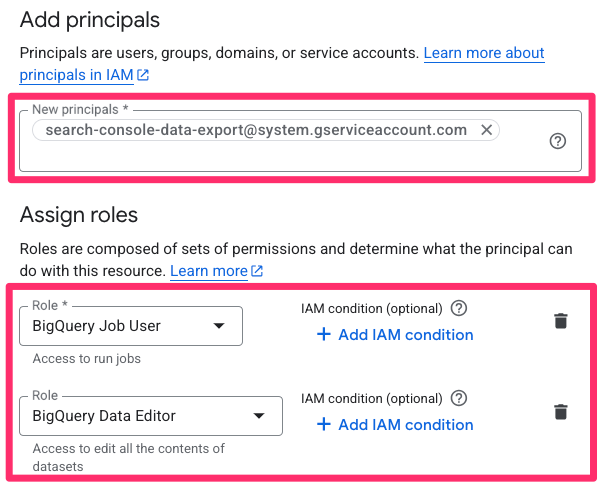
After that, you’ll need to configure permissions so that Google Search Console can send data to your BigQuery project. To do this, search for “IAM” in the console and click “Grant access.” Paste the following email into the field: [email protected]. Then, assign the roles BigQuery Job User and BigQuery Data Editor, and click “Save.”
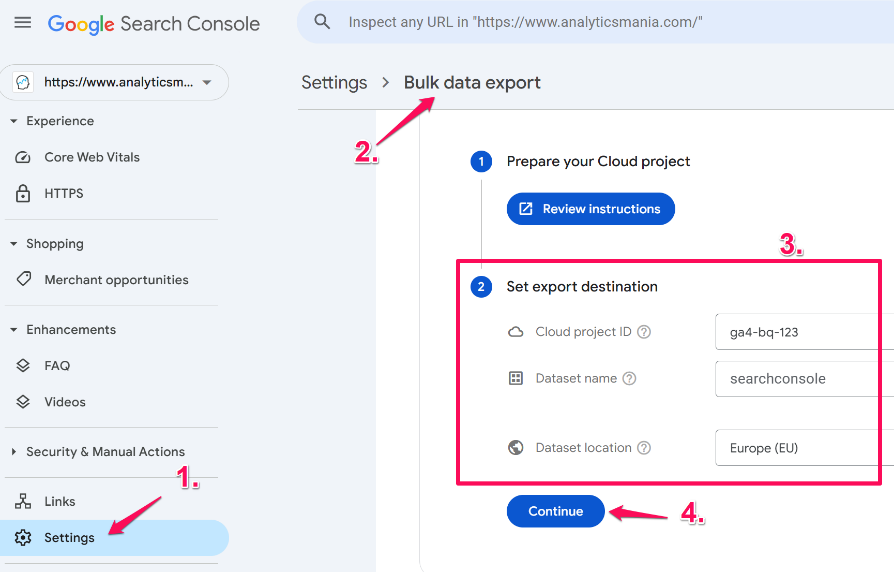
Now, head over to your Google Search Console property. Go to Settings > Bulk data export, then enter your Cloud project ID (you can find this in the project picker in BQ). Optionally, you can change the Dataset name and Dataset location. When you’re ready, click “Continue.”
The data may take a few days to appear in BigQuery, so don’t worry if you don’t see anything immediately.
BigQuery does come at a cost, and you can find more details here. From my experience, the costs are pretty minimal, like cents, but this will vary depending on how much data you are storing in BigQuery.
To dive deeper into the setup, Google provides an official guide you can check out here.
Querying Google Search Console Data in BigQuery
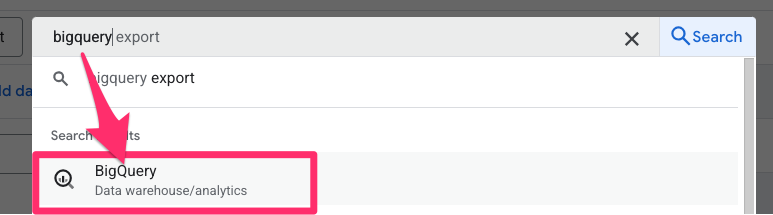
To start querying your Google Search Console data in BigQuery, head back to the BigQuery interface. Search for “BigQuery” and click the first option.
Here, you’ll see the Explorer pane on the left side, which contains a directory of datasets, tables and saved queries (and some more things that we won’t worry about for this tutorial).
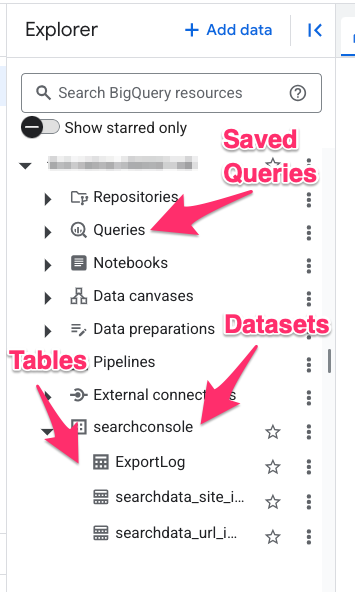
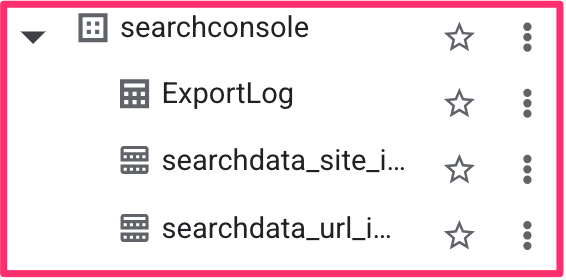
With this connection, you will have a dataset named searchconsole that contains two tables: searchdata_site_impression, which is data aggregated by property and searchdata_url_impression, which is data aggregated by URL.
For this tutorial, we will mainly focus on searchdata_site_impression.
Alternatively, you can check out the video tutorial on how to query Search Console data in BigQuery over at the Analytics Mania YouTube channel.
Understanding the data
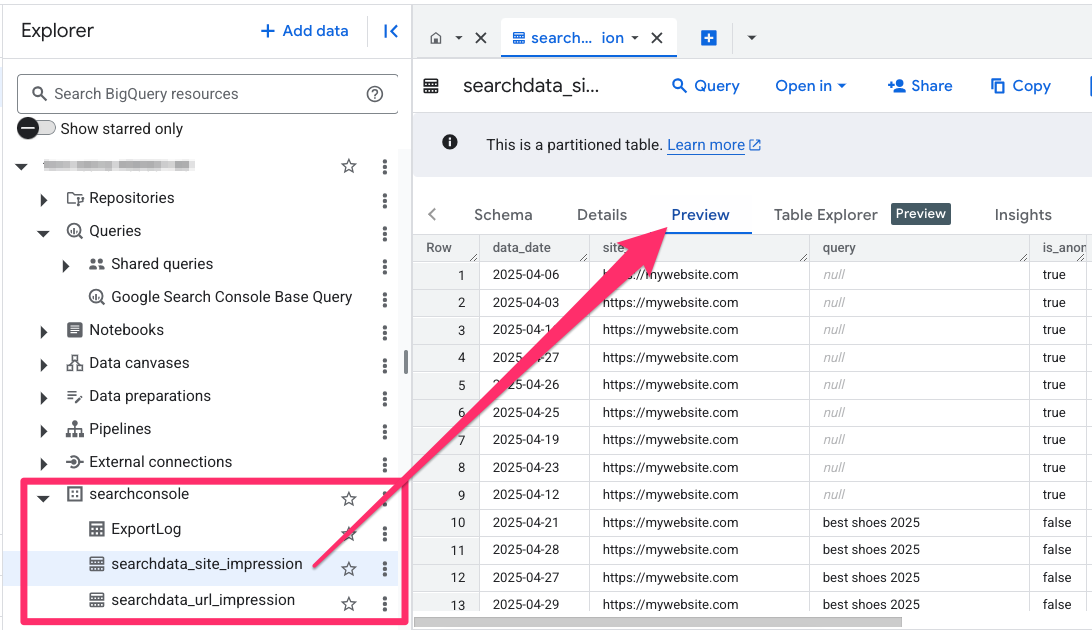
You can see a preview of the data contained in any table by selecting the table from the Explorer panel and then going to the Preview tab. It would be good to explore the data to understand the type of information you want and can get from here.
For this examples click the dropdown next to the searchconsole dataset and choose the search_site_impression table. This will open a new tab to the right. Click on the Preview tab. Here, you can see a subset of the data contained in this table.
Data Schema
Once your data starts flowing into BigQuery, it’s helpful to understand the structure of the data. Here’s a breakdown of the key fields you’ll be working with:
- data_date: This indicates the date the data was recorded. Keep in mind that Google Search Console data is available with a two-day delay, so the most recent data available will always be from two days prior.
- site_url: This is the property’s URL. For domain-level properties, it will appear as sc-domain:property-name, while for URL-prefix properties, it will be the full URL, such as https://mywebsite.com/help/.
- query: The actual search term the user typed into Google.
- is_anonymized_query: When this is true, the query field will be null.
- country: The country where the search originated.
- search_type: The type of Google search. This can be one of several values:
- WEB: The default search tab.
- IMAGE: Google Images.
- VIDEO: Google Videos.
- NEWS: Google News.
- DISCOVER: Google Discovery feed.
- GOOGLENEWS: news.google.com and the Google News app.
- device: The type of device the user was using (e.g., desktop, mobile, tablet)
- impressions: The number of times a link to your site was shown in the search results.
- clicks: The number of times users click on a link to your site from the search results.
- sum_top_position: The sum of search result positions (with 0 being the top spot) for all impressions in this row. You can calculate the average position (which is 1-based) with SUM(sum_top_position)/SUM(impressions) + 1 (we’ll do that a bit later).

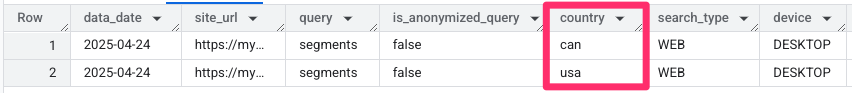
For example, this row of data tells us that on April 13, 2025, there were people in Canada who searched for the term “buy shoes” using Google Search on a desktop device. A search result linking to my website appeared 79 times (impressions) and was clicked 36 times. The total of all the positions where my site appeared adds up to 389.

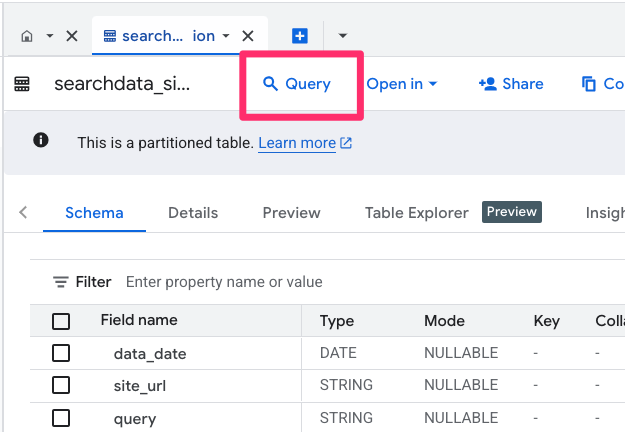
Create a basic query
To create a basic query, click the “Query” button. This will load an incomplete sample query to get you started:
- SELECT: This is where you list the columns (or “keys”) from the table you want to include in your results.
- FROM: This line contains the full path to the table you’re querying, such as yourproject.searchconsole.searchdata_site_impression.
- WHERE: Here, you add filters to narrow down your data. By default, it will filter the data_date by the current day.
- LIMIT: This limits the number of rows returned in your query results. It’s important to note that this only affects how many rows are shown in your output, and it does not reduce the amount of data processed (and therefore doesn’t reduce costs).
Query all the data
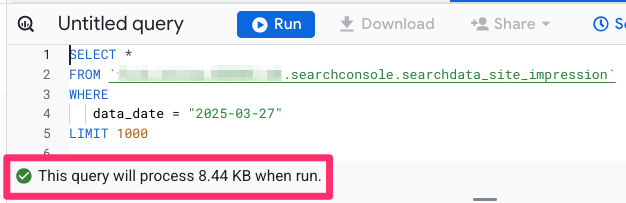
When writing a simple query to pull data from a table, you can use the asterisk (*) symbol in the SELECT clause. This tells BigQuery to return every column from the table.
SELECT *
FROM `my-project.searchconconsole.searchdata_site_impression`
WHERE
   data_date = "2025-03-27"
LIMIT 1000
Before running your query, take a look at the bottom-left corner of the BigQuery interface. You’ll see an estimate of how much data BigQuery will process for this query. This is useful because BigQuery offers 1 TB of free query processing per month. If you have a ton of data, querying using * can quickly become costly.
When you’re just starting to build or test a new query, even if you ultimately wish to analyze data for a month or year, it’s best to start with a smaller data range, like a single day or week. This lets you confirm that your query returns what you want. You might need to run and tweak your query a few times so that you don’t immediately query a ton of data.
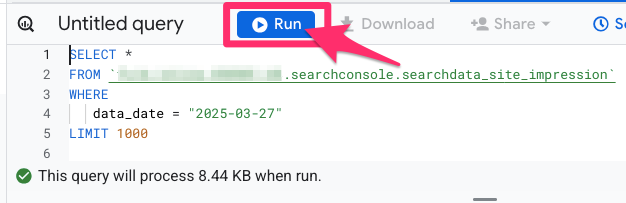
Once your query is ready, click “Run” (or CTRL+Enter on your keyboard) to execute the query.
Query clicks and impressions for the keywords
Sometimes, you may just want a simple overview, like the total number of impressions or clicks for each query (just to clarify, when I say “query” here, I’m referring to the search term). This kind of summary can help you quickly identify which search terms drive the most visibility to your site.
One thing to note is that the same query can appear in multiple rows. Why does this happen? Since the data also collects information like country and device, if someone in Canada and the US searches for “segments,” the data will appear in two separate rows because the country values differ. The same happens if a search occurs on both mobile and desktop devices.
How can you overcome this? Use the SUM function to aggregate your metrics, like impressions or clicks. When using an aggregate function, it’s good practice to name that column using AS so it’s easier to understand the output,
Also, because you’re aggregating data, you must include a GROUP BY clause. This tells BigQuery how to group the rows before applying the aggregation.
SELECT
   query,
   SUM(clicks) AS clicks
FROM `my-project.searchconconsole.searchdata_site_impression`
WHERE
   data_date = "2025-03-27"
GROUP BY
   query
You’ll notice that some rows have a null value for the query field. This happens when is_anonymized_query is set to true. Since these rows don’t use meaningful data, we want to exclude them by adding a filter to the query.
To focus on the most effective search terms, we can also sort the results by the number of clicks using the ORDER BY function. This allows us to see the top-performing queries first. You can use either ASC (for ascending order, A-Z) or DESC (for descending order, Z-A) after the column name to tell BQ how you want the data to be ordered.
We’ll also add impressions to the query using the same SUM() function as for clicks. To keep the data focused, we’ll filter it to only include searches that came from the web.
SELECT
   query,
   SUM(clicks) AS clicks,
   SUM(impressions) AS impressions
FROM `my-project.searchconconsole.searchdata_site_impression`
WHERE
   data_date = "2025-03-27"
   AND is_anonymized_query = false
   AND search_type = 'WEB'
GROUP BY
   query
ORDER BY
   clicks DESC
If you want just to see the top 10 keywords, you can adjust the LIMIT function.
SELECT
   query,
   SUM(clicks) AS clicks,
   SUM(impressions) AS impressions
FROM `my-project.searchconconsole.searchdata_site_impression`
WHERE
   data_date = "2025-03-27"
   AND is_anonymized_query = false
   AND search_type = 'WEB'
GROUP BY
   query
ORDER BY
   clicks DESC
LIMIT 10
Create additional metrics
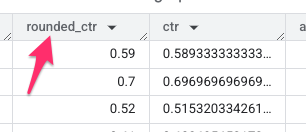
One of the advantages of using SQL in BigQuery is the versatility to create your own custom metrics, e.g., clickthrough rate, which is the percentage of impressions that lead to a click, and the average position, which is based on the sum_top_position key.
To make your data look nicer, the ROUND() function comes in handy by rounding the number of decimal places displayed in the results.
You can also customize the order of the columns of your output by reordering them in the SELECT statement. This makes it easy to prioritize the metrics and dimensions most matter to you. Typically, you’d start with all the dimensions and then move into the metrics.
SELECT
   query,
   SUM(clicks) AS clicks,
   SUM(impressions) AS impressions,
   ROUND(SUM(clicks) / SUM(impressions), 2) AS ctr,
   ROUND(SUM(sum_top_position) / SUM(impressions) + 1.0, 1) AS avg_position
FROM `my-project.searchconconsole.searchdata_site_impression`
WHERE
   data_date = "2025-03-27"
   AND is_anonymized_query = false
   AND search_type = 'WEB'
GROUP BY
   query
ORDER BY
   clicks DESC
LIMIT 10
Update Date Range
As I said before, it’s good to build a query using just one day of data since you’ll likely need to run it a lot before you figure out exactly what you want. Once you’ve finalized the query, you can expand the date range to fit your needs. If you’re going to analyze data between two specific dates, you can use the BETWEEN command.
SELECT *
FROM `my-project.searchconconsole.searchdata_site_impression`
WHERE
   data_date BETWEEN "2025-03-01" AND "2025-03-31"
You can also set up the date to update more dynamically by using the CURRENT_DATE() and INTERVAL commands.
Something to note with the query below is that Google Search Console data has a two-day delay. This means that if you set your date range to the past 30 days, you’ll actually get data for 28 days (the most recent two days will not be included).
SELECT *
FROM `my-project.searchconconsole.searchdata_site_impression`
WHERE
   data_date >= CURRENT_DATE() - INTERVAL 30 DAY

Query Recipes
Now that we’ve walked through how to build basic queries, here’s a more complete version that includes several useful components. You can copy this query and adapt it to fit your needs. Just keep, update, or remove the parts as you see fit.
Personally, I find it helpful to save a base query like this as a starting point. It makes building new queries much faster and more consistent.
If there are some lines that you don’t need right away but still want to keep around, you can use “–” to comment out those lines. That way, they won’t affect the output but are still there for reference, e.g. we talked about different ways of filtering data, so if you want to have both options available for future use, you can just comment out one of the options.
SELECT
   query,
   SUM(clicks) AS clicks,
   SUM(impressions) AS impressions,
   ROUND(SUM(clicks) / SUM(impressions), 2) AS ctr,
   ROUND(SUM(sum_top_position) / SUM(impressions) + 1.0, 1) AS avg_position
FROM `my-project.searchconconsole.searchdata_site_impression` -- add project name
WHERE
   data_date BETWEEN "YYYY-MM-DD" AND "YYYY-MM-DD" -- update with dates
   -- data_date >= CURRENT_DATE() - INTERVAL 30 DAY -- another option
   AND is_anonymized_query = false
   AND search_type = 'WEB'
GROUP BY
   query
ORDER BY
   clicks DESC
LIMIT 10
Filtering Queries
There are many different ways that you’ll need to filter your data based on what your end goal is for that specific query.
Using query LIKE ‘%text%’ allows you to filter the results to only include keywords that match a specific pattern. For example, if you replace %text% with %segment%, you’ll get keywords like “segments”, “segmentation” or “help with segments” (learn more about the LIKE operator here).
SELECT
   query,
   SUM(clicks) AS clicks,
   SUM(impressions) AS impressions,
   ROUND(SUM(clicks) / SUM(impressions), 2) AS ctr,
   ROUND(SUM(sum_top_position) / SUM(impressions) + 1.0, 1) AS avg_position
FROM `my-project.searchconconsole.searchdata_site_impression` -- add project name
WHERE
   data_date BETWEEN "YYYY-MM-DD" AND "YYYY-MM-DD" -- update with dates
   -- data_date >= CURRENT_DATE() - INTERVAL 30 DAY -- another option
   AND is_anonymized_query = false
   AND search_type = 'WEB'
   AND query LIKE '%text%' -- replace text with your desired string
GROUP BY
   query
ORDER BY
   clicks DESC
LIMIT 10
What if you want to filter by a few different keywords? This is where regex can help! Here, you can filter results based on keywords containing any of several specific terms using regex, e.g., (ga4|funnel) will return keywords like “ga4 installation” and “explorations funnel.” For this purpose, I’ve added REGEXP_CONTAINS(query, r'(text|anotherText)’) to the query.
SELECT
   query,
   SUM(clicks) AS clicks,
   SUM(impressions) AS impressions,
   ROUND(SUM(clicks) / SUM(impressions), 2) AS ctr,
   ROUND(SUM(sum_top_position) / SUM(impressions) + 1.0, 1) AS avg_position
FROM `my-project.searchconconsole.searchdata_site_impression` -- add project name
WHERE
   data_date BETWEEN "YYYY-MM-DD" AND "YYYY-MM-DD" -- update with dates
   -- data_date >= CURRENT_DATE() - INTERVAL 30 DAY -- another option
   AND is_anonymized_query = false
   AND search_type = 'WEB'
   AND REGEXP_CONTAINS(query, r'(text|anotherText)') -- replace text with your desired string
GROUP BY
   query
ORDER BY
   clicks DESC
LIMIT 10
Even if you don’t include a specific column in your SELECT statement, you can still use it to filter the results. For example, you might filter by device = ‘DESKTOP’ or country = ‘usa’ without showing those fields in the output.
SELECT
   query,
   SUM(clicks) AS clicks,
   SUM(impressions) AS impressions,
   ROUND(SUM(clicks) / SUM(impressions), 2) AS ctr,
   ROUND(SUM(sum_top_position) / SUM(impressions) + 1.0, 1) AS avg_position
FROM `my-project.searchconconsole.searchdata_site_impression` -- add project name
WHERE
   data_date BETWEEN "YYYY-MM-DD" AND "YYYY-MM-DD" -- update with dates
   -- data_date >= CURRENT_DATE() - INTERVAL 30 DAY -- another option
   AND is_anonymized_query = false
   AND search_type = 'WEB'
   AND REGEXP_CONTAINS(query, r'(text|anotherText)') -- replace text with your desired string
   AND device = 'DESKTOP'
   AND country = 'usa'
GROUP BY
   query
ORDER BY
   clicks DESC
LIMIT 10
I recommend reading up on some SQL to learn more about the different functions and methods available to customize your queries; you can get really crazy with it or just keep it simple, depending on what you need! W3 Schools is a great place to start since it has free tutorials and some practice problems.

Saving queries for future use
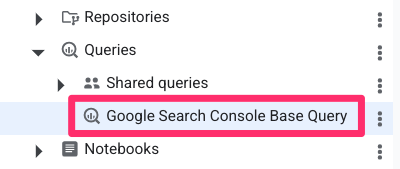
To save this query for future use, go to Save > Save query, give it a name and click “Save.” This is helpful so you can come back to this base query, copy it and build other queries off of it.
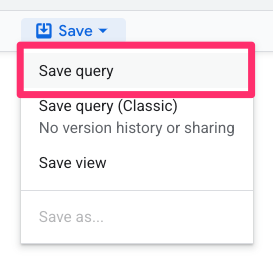
You’ll find it under Queries in the Explorer panel.
Similarly, you can save your query as a view by selecting Save query > Save copy as view.
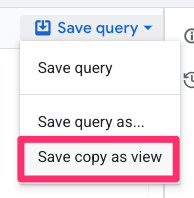
This creates a virtual table you can easily reference later, giving you access to your results without rerunning the query each time.
Link and Query Google Search Console Data in BigQuery: Final Words
Connecting Google Search Console to BigQuery opens up a new level of flexibility and the ability to analyze your search performance. With just basic SQL skills, you can build out some simple, but effective queries that show you information beyond what’s available in the standard Google Search Console interface.
As with anything, start small and experiment with some queries. Leave a comment down below with any questions that you might have!

2 COMMENTS
Hi Julius, would this be a solution to link GSC and GA4 data and have insight into which specific queries led to which key events?
Hi Julius,
Thank you very much for the tutorial. As I still had issues to write "error-free" SQL, https://www.gscbigquery.com/ was my rescue. It allows configuring the desired output and generates the corresponding SQL. Highly recommended!