
May 28, 2025
Track Content Engagement using Google Analytics 4 Funnels
This article was written by Jude Nwachukwu, who was kind to share his tips with Analytics Mania’s readers
There are several ways to measure content performance using Google Analytics, including utilizing Google Analytics (GA4) funnels for business and marketing insights.
In this guide, I’ll walk you through a straightforward method to use funnels in Google Analytics to determine whether your blog post readers actually scrolled, an action that can loosely indicate whether they consumed your content.
We’ll also explore how content consumption varies across different dimensions, such as device type, browser, author, article, etc.
We’ll build this report using Google Analytics Funnel Exploration, and I’ll also show you how to add it to your standard reports for easy access for your clients or other collaborators.
Keep in mind that scroll activity isn’t a perfect indicator of content engagement and consumption; a user might scroll to the bottom without actually reading the post. There are some limitations to this approach.
That said, using funnel analysis in Google Analytics can still offer a high-level overview of content consumption, as well as granular insights into how that presumed content consumption differs across devices, browsers, content groups, and other variables.
It can also help identify blog posts that receive a high volume of visits but show little to no scroll activity, signalling potential issues with engagement. You can even get creative with this methodology to uncover new patterns and ideas.
Now that you know what to expect in this guide, let’s head into the use case and build this step by step.
Table of Contents
Here’s what you will learn in this article
- Prerequisites for Using GA4 Funnels in This Approach
- Setting Up the Content Consumption Performance Funnel Report
- Adding Scroll Thresholds as Funnel Steps
- Analyzing Scroll Behavior (Content Consumption) by Dimension
- Saving the Funnel to Your Reports Library
- Final Words
Prerequisites for Using GA4 Funnels in This Approach
To use Google Analytics 4 (GA4) funnels to measure content performance as this methodology outlines, you must first track scroll depth and do that accurately.
You’ll need more than the default 90% scroll event GA4 captures through Enhanced Measurement.
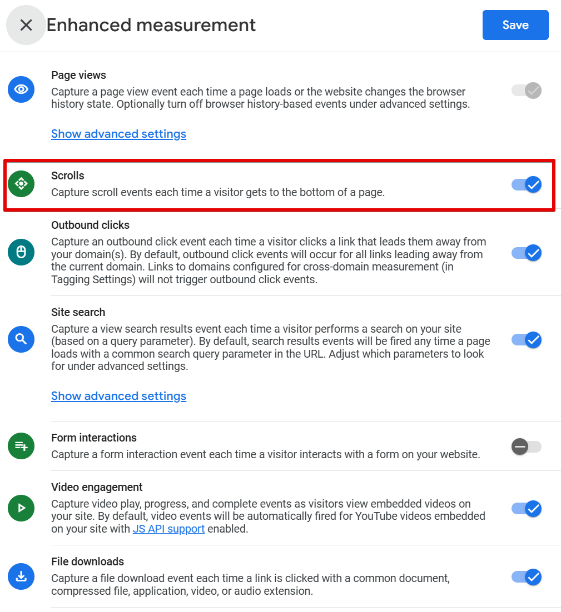
Instead, you’ll need to implement custom scroll depth thresholds such as 25%, 50%, and 75% using Google Tag Manager (GTM).
This guide on Analytics Mania should help.
Additionally, your blog content should be identifiable via content groups or a recognizable URL path pattern (e.g., /post/).
Setting Up the Content Consumption Performance Funnel Report
Once the prerequisites are in place, let’s walk through how to build a funnel report in GA4.
1. Navigate to the “Explore” section in GA4 and click “Create a new exploration”, then choose “Funnel Exploration.”
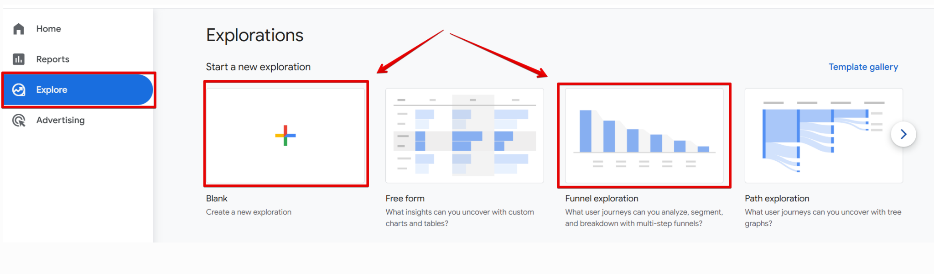
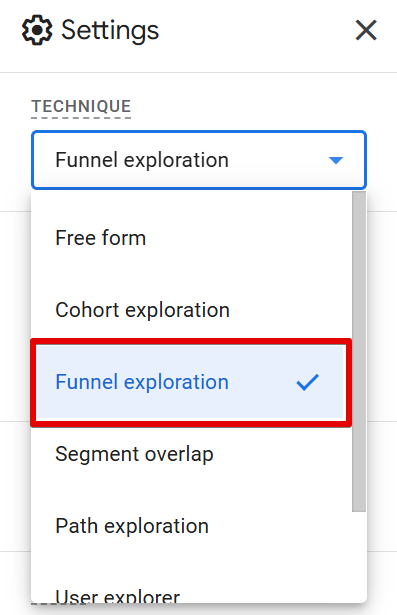
If you started from a blank exploration, you can switch the technique to “Funnel” in the “Settings” panel.
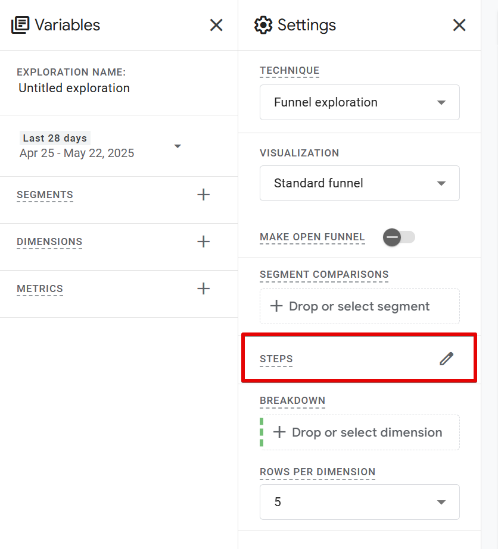
2. Next, define your funnel steps. In the “Steps” section of the report, click “Add Step” to begin.
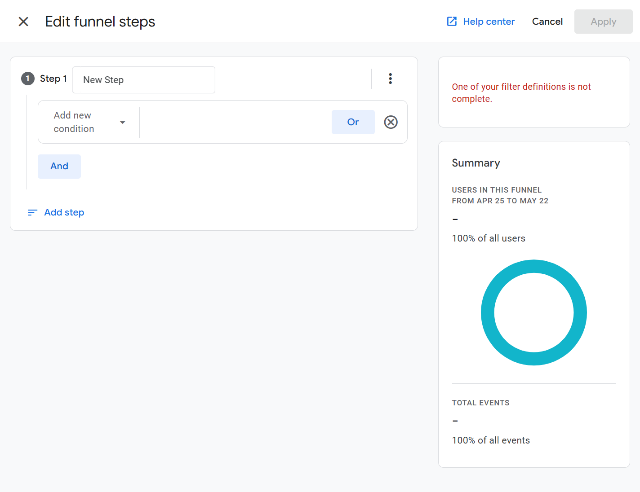
3. A blank canvas will appear. For the first step, select the page_view event.
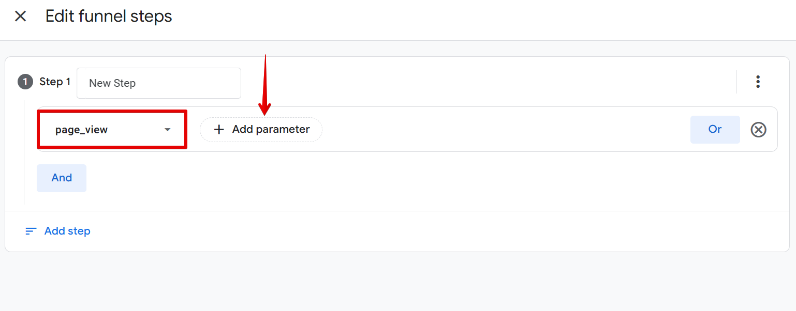
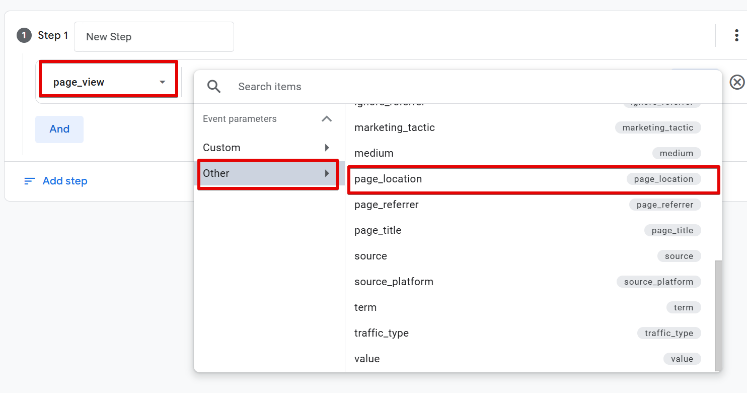
4. Click “Add Parameter”, and here you can filter using either a content group or page_location (URL path).
Content Groups option in the filter.
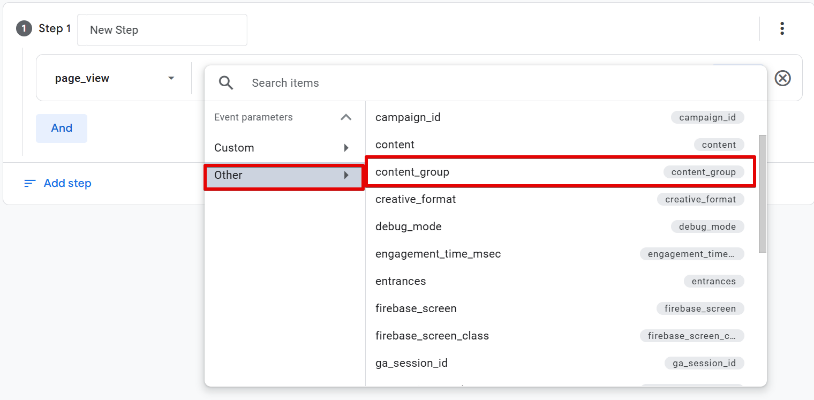
If you’re using a content group for the first time, you’ll need to register it as a custom dimension (event-scoped). However, this means historical data won’t be available in your funnel report.
To report on historical data and avoid using up a custom dimension slot, using page_location with a URL pattern, such as /post/, is recommended.
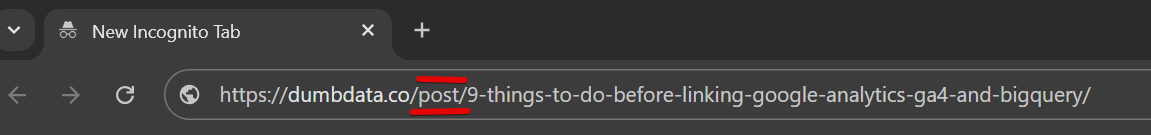
In my example, I’m using /post/ as the URL path filter.
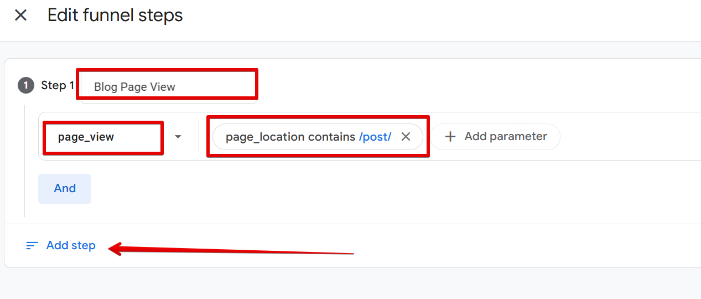
Name the step appropriately, e.g., “Blog Page View”.
Adding Scroll Thresholds as Funnel Steps
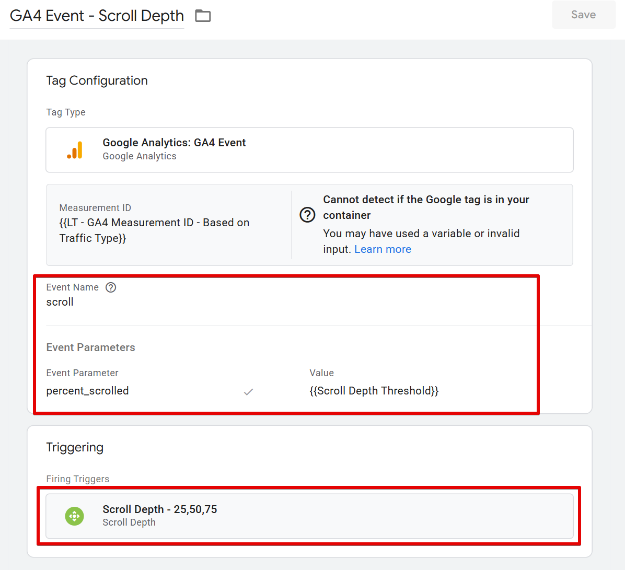
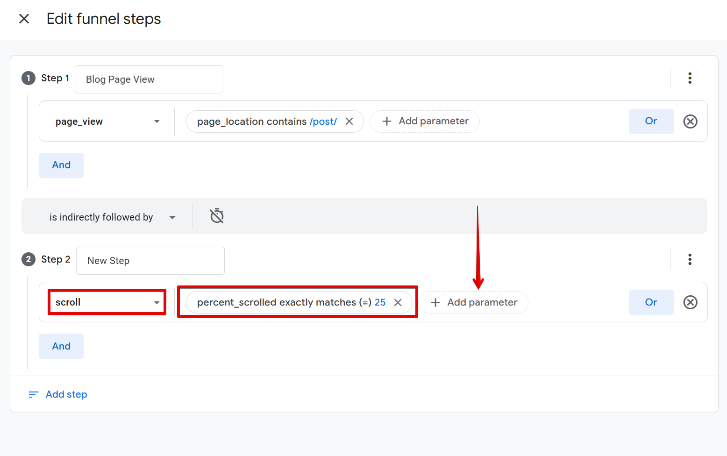
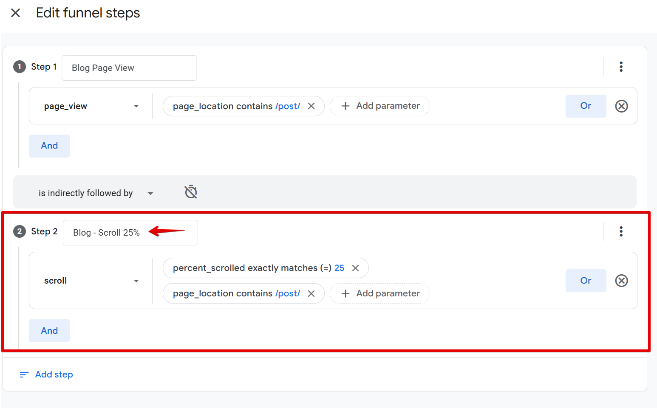
For the next step, use the scroll event.
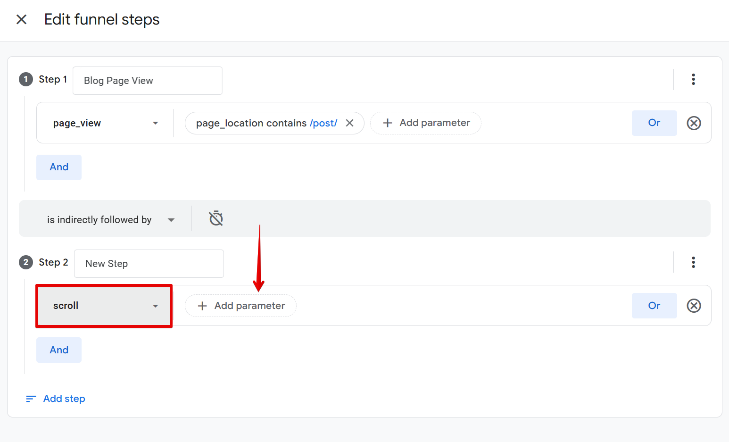
- Add a parameter: percent_scrolled
- Enter the value 25 (or your initial scroll threshold).

Again, use either the content group or page_location filter to restrict the event to blog posts.
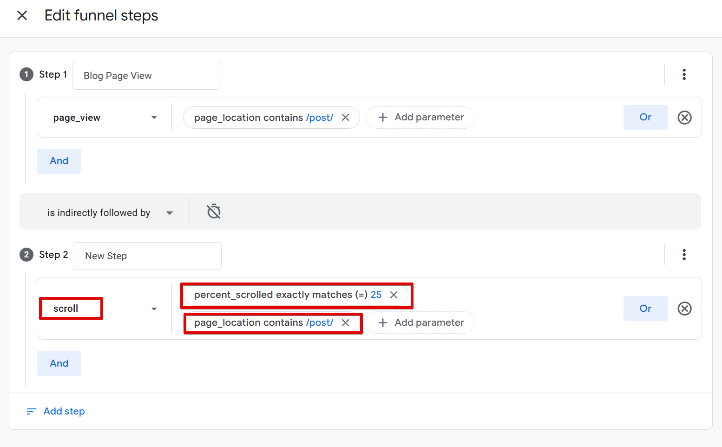
Give this step a name like “Blog – Scroll 25%”.
To speed things up, you can duplicate this step by clicking the three-dot icon and selecting “Copy Step”.
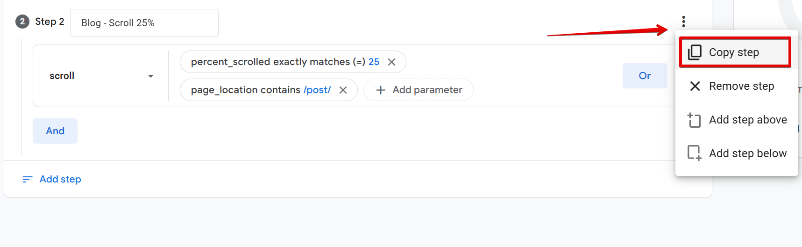
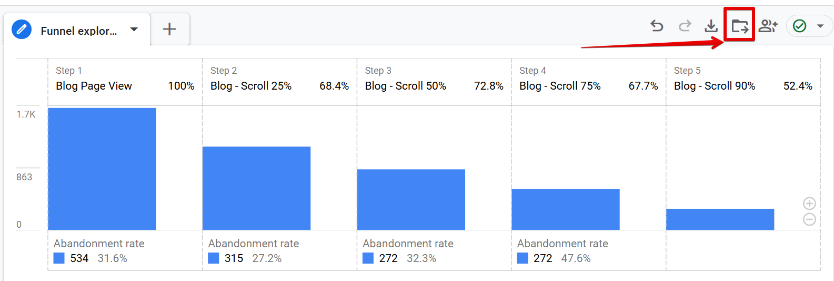
Then, just update the percent_scrolled value to 50, 75, and 90, and rename each step accordingly.
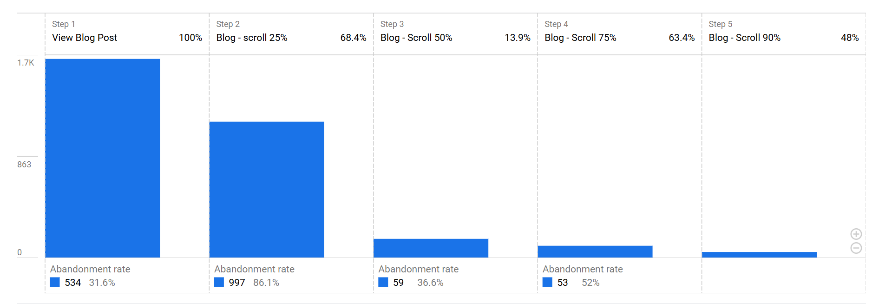
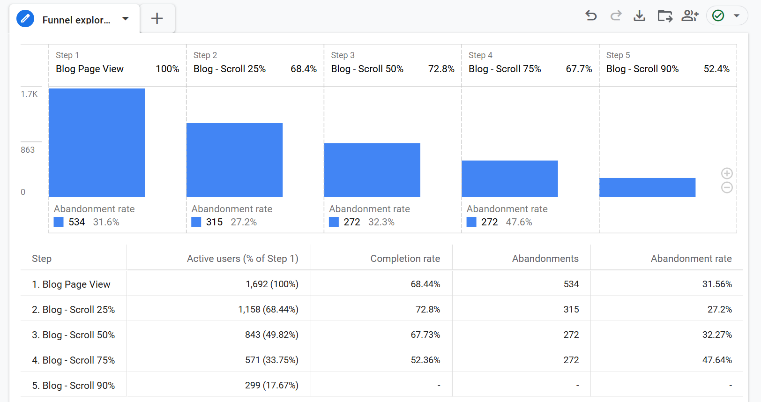
After completing all steps, your funnel should resemble the structure below:
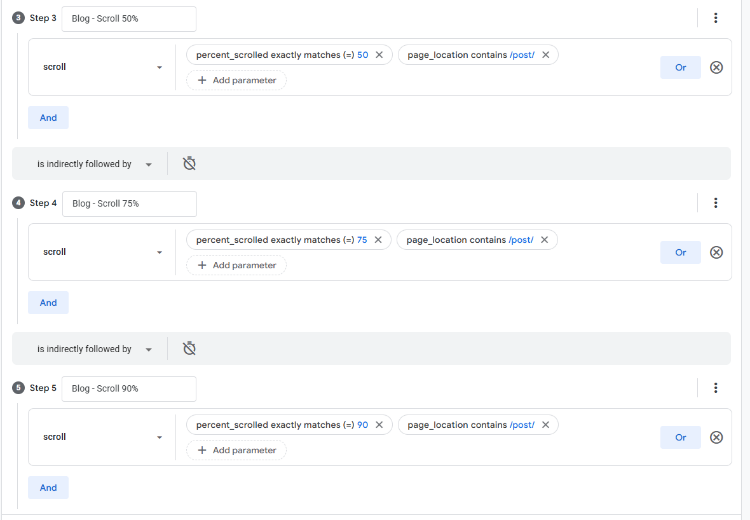
Click “Apply” once you’re done.
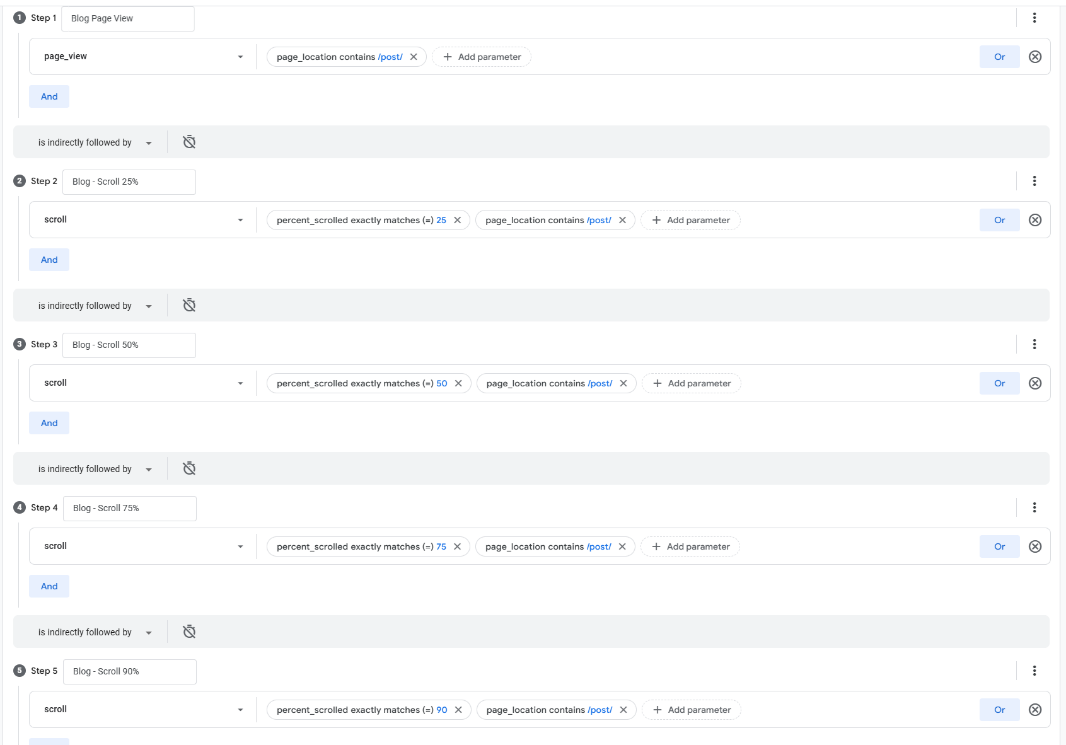
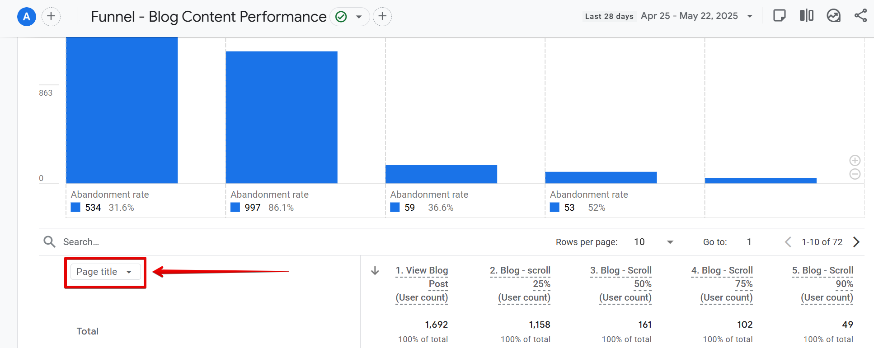
You now have a funnel report that shows how users scroll through your blog posts.
Note that when building funnels in Google Analytics, I always set the step sequence condition to “is indirectly followed by” before adding the next step. This allows for more flexibility in how users progress through the funnel.

Analyzing Scroll Behavior (Content Consumption) by Dimension
The current form of the funnel report provides high-level scroll engagement as content consumption, but to gain granular (possibly deeper) insights, such as how behavior varies by device, author, article, or traffic source, you can break down the data further.
To do this:
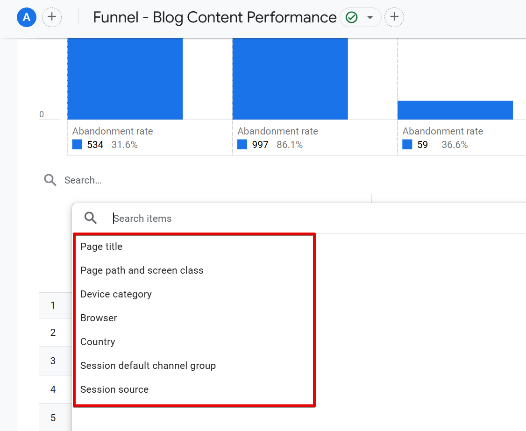
Click the “+” icon in the “Dimensions” section under the “Variables” tab.
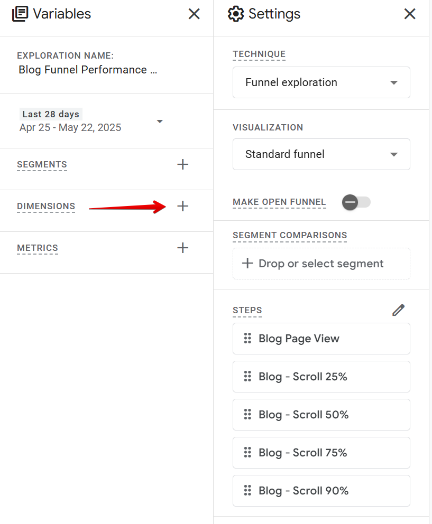
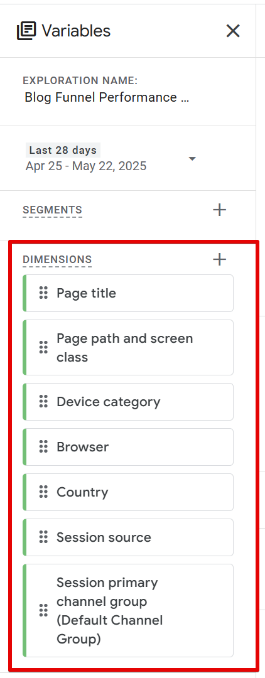
Add the following recommended dimensions:
- Page title
- Page path
- Device category
- Browser
- Country
- Session source
- Session default channel group
You can also include custom dimensions like author name, category, or word count for more granular insights.
Once added, you can apply these dimensions as breakdowns in the Settings panel by selecting them under the “Breakdown” section.
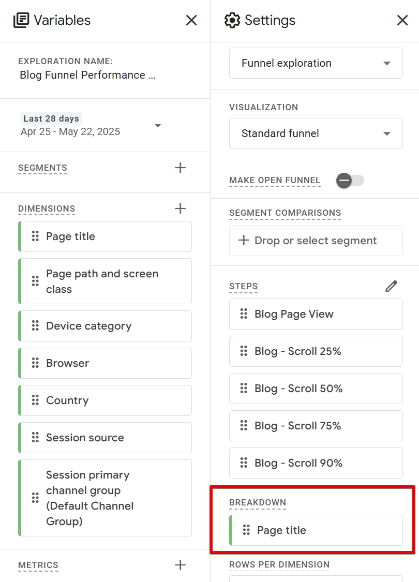
This allows you to view segmented performance directly within the Exploration view.
Additionally, the dimensions will also be feasible when you make this funnel exploration a standard GA4 report, as a dropdown.
Saving the Funnel to Your Reports Library
To make this funnel report accessible to collaborators and usable as a standard report:
1. Click the folder icon to “Save as a report in the Library.”
2. A modal will appear where you can enter a report name and description, then click “Save.”
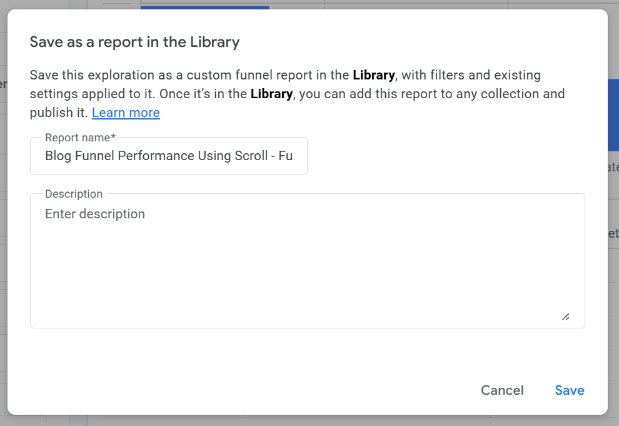
Doing this will save the funnel exploration as a standard GA4 report.
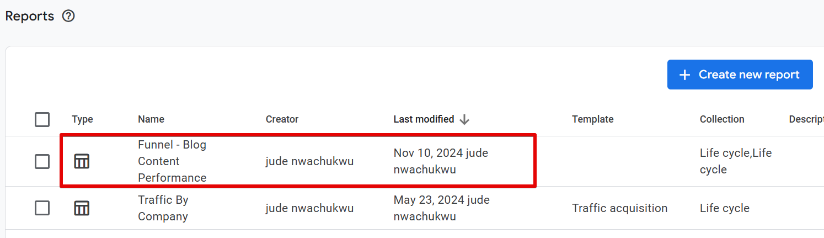
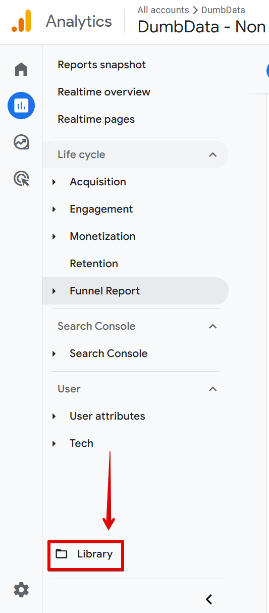
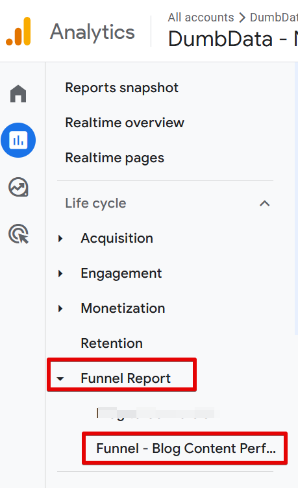
3. Go back to your GA4 Reports section and click on the Library (folder icon).
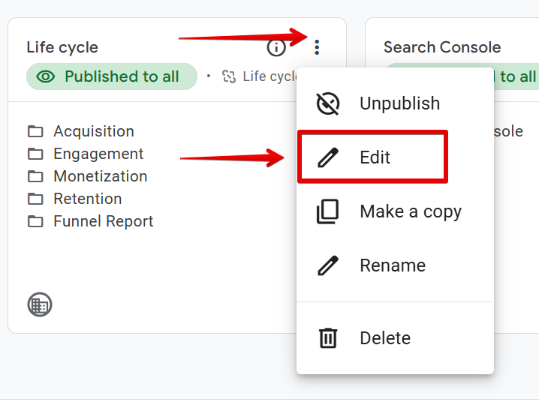
4. Select the collection you’d like to edit, click the three-dot menu, and choose “Edit Collection.”
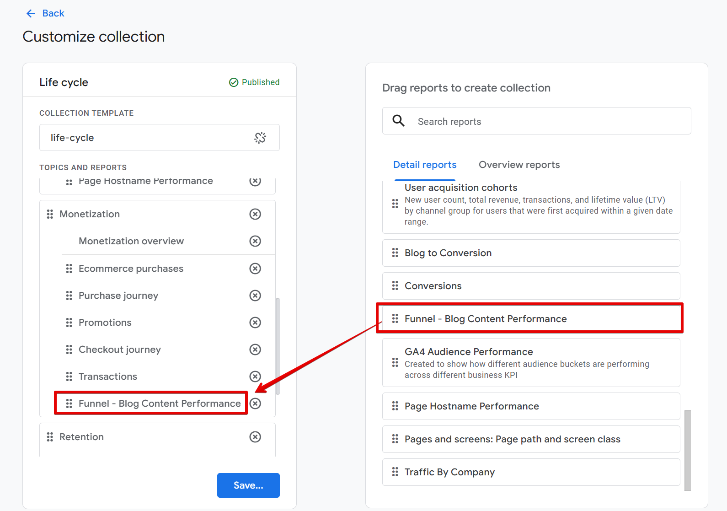
5. Add the funnel report under a topic section and place it within the “Detail reports” area.
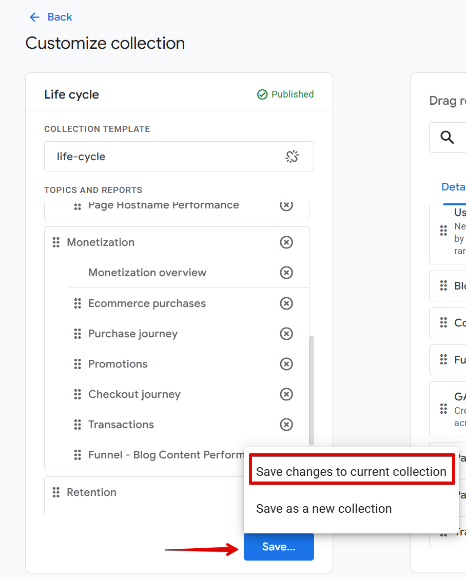
6. Click “Save” and then “Save changes to current collection.”
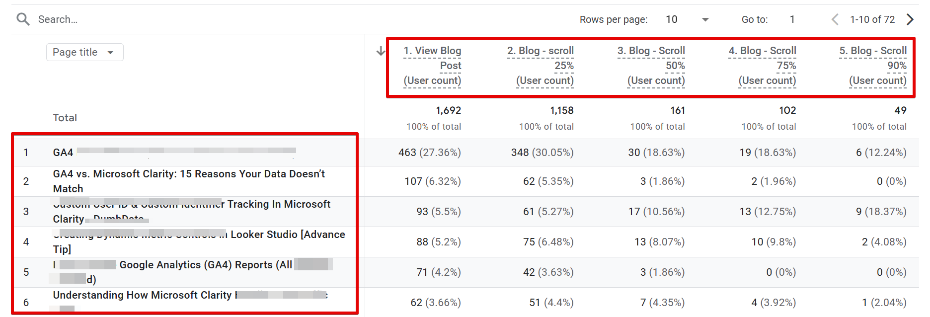
Your funnel report is now available under the standard reports section, which you and your team can access easily.
From there, you can use the dropdowns to apply breakdown dimensions and analyze content performance, like consumption, across various segments.
By reviewing scroll depth by article, you can sort the funnel steps (e.g., by ascending scroll rate) to identify blog posts with poor engagement, where users aren’t reaching even the 50% scroll mark.
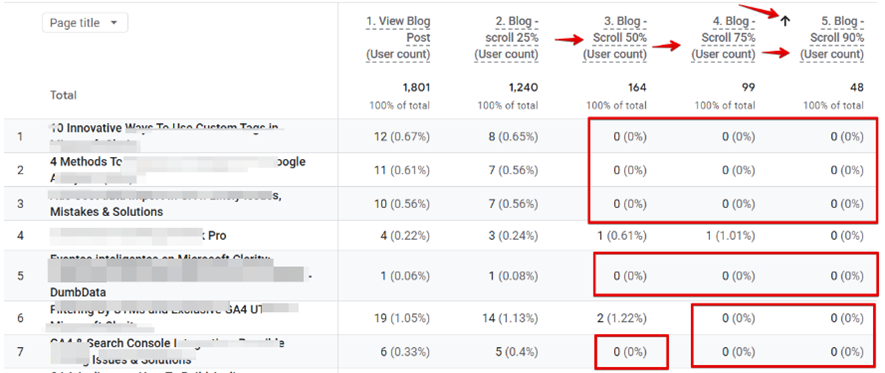
These insights can help you take targeted actions to improve content structure, readability, or design.
Note: A user not reaching the 50% scroll threshold (or beyond) doesn’t necessarily mean the article isn’t valuable. In some cases, readers may find the answer they’re looking for early in the content and see no need to continue reading further.
Understanding this type of reading behavior and other possible patterns provides useful context for interpreting the data more impactfully.
Track Content Engagement using Google Analytics 4 Funnels: Final Words
The funnel report offers some level of helpful indicators into how your published articles are consumed, highlighting which parts of your content are being read and which are not. It can help you uncover patterns in reader behavior that inform how you approach content creation and optimization.
However, it’s important to be mindful of the limitations of using Google Analytics funnels for measuring content performance. As mentioned earlier, some users may scroll straight to the bottom of an article without actually reading it, which can skew the interpretation of scroll-based engagement metrics.
That said, there are many ways to track content engagement and report on performance. In this guide, I’ve walked you through a simple, actionable method that you can start implementing right away.
One innovative addition you can include to your content engagement funnel is tracking a key action at the bottom of your articles, such as subscribing to a newsletter, clicking an email link to contact your team, or interacting with a helpfulness rating element. If you have these actions in place or something similar, consider adding them as the final step in your funnel to see how many readers go from consuming content to taking meaningful action.
Just remember to factor in the different reading behaviors we’ve covered in this guide when analyzing your results. Not every visitor will follow a linear path, and that’s okay.


0 COMMENTS