
December 11, 2025
How to Exclude Internal Traffic in Google Analytics 4
Updated: December 11th, 2025
When you implement Google Analytics 4, you are tracking your own interactions/events as well. That’s the default. That becomes an even larger problem when working with a larger business (having more employees). Every visit/event made by an employee skews your data. Luckily, this can be fixed because you can exclude internal traffic in Google Analytics 4.
But there are several catches here. If you exclude yourself, you won’t be able to see your events in the DebugView (while testing with GTM). GA4 documentation says it should work fine with the developer filter, but the reality is different. At least when I am writing this article.
And if you have to exclude multiple people, relying on the IP address might not be the best option. In this blog post, I wanted to show you how to exclude internal traffic in Google Analytics 4 and tackle the aforementioned two problems.
However, the IP-related option will also be described.
Table of contents
– Here’s what you will learn in this article –
- The limitation with the Internal Traffic Filter in GA4
- How the Internal Traffic Filter works
- Warning for the users of GTM server-side tagging
- Method #1 – excluding internal traffic by IP address
- Method #2 – excluding internal traffic with the data layer
- Method #3 – excluding internal traffic based on a cookie
- Send internal data to a separate GA4 property
- Final words
Video tutorial
Prefer video content? Here’s a tutorial from my Youtube channel. If you want to stay up-to-date with GA4, consider subscribing.
Choosing Your Method: IP vs. Data Layer vs. Cookie
This guide presents three main ways to identify internal traffic before applying the GTM override logic. Here’s a comparison to help you choose (and more details will be explained a bit later):
|
Method |
How internal traffic is identified | Pros | Cons |
Best for |
| IP Address | GA4 automatically adds traffic_type=internal based on IPs defined in Data Stream settings. GTM overrides this only during Preview mode. | – No developer needed (uses GA4 UI).
– Relatively simple initial setup. |
– Unreliable with dynamic IPs or VPNs.
– Hard to manage many IPs. – Doesn’t work well with Server-Side GTM. |
Small teams with static office IPs. |
| Data Layer | Developer pushes a parameter (e.g., traffic_type: ‘internal’) to the Data Layer for internal users before GTM loads. GTM reads this and overrides during Preview mode. | – IP address independent (works with dynamic IPs/VPNs).
– Potentially more accurate if based on login/user ID. |
– Requires developer work to implement the dataLayer.push.
– Might miss users before login or if the identification logic fails. |
Teams where developers can implement backend logic to reliably identify internal users (e.g., via login status). |
| Cookie | Employees visit a special URL (?internal_user=true), GTM sets a cookie (gtm_internal_user=’internal’). GTM reads this cookie value and overrides during Preview mode. | – No developer needed (uses GTM).
– IP address independent. |
– Relies on cookies (can be cleared, expire quickly on Safari/iOS due to ITP).
– Requires employees to periodically visit the special URL. – Doesn’t work across devices. |
Teams where managing IPs is difficult, developer resources are limited, and employees can be instructed to periodically refresh the cookie. |
Important: Some weird things. A delay?
While writing this blog post, I did various experiments with filters in GA4 to understand how they work (because not every scenario is clearly explained in Google’s documentation).
The weird things started when, sometimes, the same experiment (repeated several times) yielded different results. Thus, trying to dig deeper was indeed very frustrating. Eventually, I concluded there is some delay between editing/changing the filter and what you see in the DebugView.
For example, even 10 minutes after deactivating the internal traffic filter, I still could not see my events in the DebugView (until I changed my IP address).
So, this blog post results from various experiments, and I hope I did that right. If you notice anything incorrect, please let me know.
There is always a chance that something was not working properly in GA4 at that moment, and maybe in the future (when you are reading this), this got resolved.
The limitation of the Internal Traffic Filter in GA4
If you have ever tried to exclude internal traffic in Google Analytics 4, you have probably already found pages explaining how to use the Internal Traffic Filter. You can go to your Admin > Data Streams > X Data Stream > Configure tag settings > Show all > Define Internal Traffic, and then you enter your IP addresses.
Then, go to Admin > Data Filters > Internal Traffic and set it to Active.
Done. You have excluded your internal traffic based on IP addresses. But there’s one catch.
What if you want to exclude your internal traffic (including your own), but when you debug the GA/GTM setup, you’d still like to see yourself in the DebugView of GA4? With your current setup, that is not possible. You won’t see yourself in the DebugView. At least, that’s what was happening to me.
Update: after some time, it looked like things were improving in GA4, but now this problem is repeating again.
One option here could be to create a separate GA4 property for testing, and then (if you are in the preview mode) you could create a Lookup Table variable that picks the right property. If you’re in the Preview mode, you send data to the testing property. If you’re not debugging, the data flows to the live property.
And there’s another option that I’m going to show you. It will involve a single (live) GA4 property. If you are not debugging, your data will be excluded. But if you are debugging (with GTM’s preview mode), your data will be visible in the DebugView.

How Internal Traffic Filter works
When you define internal traffic (in the tagging settings of a Data Stream), Google Analytics 4 tracking code (activated on your site) starts adding a parameter tt=internal to every request. This parameter means “traffic type” a.k.a. traffic_type.
The default Internal Traffic Filter (that can be found in Admin > Data Filters) is preconfigured to exclude all the hits that contain the traffic_type=internal parameter (a.k.a. tt=internal). And it will do that once you set the filter to “Active”.
So, in this blog post, I’ll explain how to use that traffic_type=internal parameter and exclude internal traffic in GA4. But if someone is debugging with GTM’s preview and debug mode, then traffic_type’s value will be different, and you will still see it in the DebugView.
Warning to users of GTM server-side tagging
It looks like the built-in GA4 exclusion of internal traffic does not properly work with GTM server-side tagging. The traffic_type=internal parameter is not added to GA4 requests if requests are sent to your server-side setup first.
At least, that’s what I am seeing. This means that you would need to build the exclusion logic yourself in the GTM server (for example, set the tags to not fire if the user’s IP address matches/contains some value.

Method #1 – excluding internal traffic by IP address
Let’s start with the classic. This might work if not many people are involved in running a business, and you can easily exclude their hits by their IP addresses. This method does not work well if you have to enter many different IP addresses or if some IP addresses are not static (read: regularly changing). Or maybe your colleagues use VPNs often.
Step #1. Define your internal IP addresses
In Google Analytics 4, go to Admin > Data Streams and select your website stream.

Then click Configure tag settings:

Then click Show all and select Define internal traffic. Here you can create new internal traffic rules.

You can create separate rules for each IP if you are working with multiple IPs. Or you can create a regular expression and include multiple IP addresses there, like in the example below:

You can always enter “internal” in the traffic_type value field to simplify things. Then it will be enough to have one Internal Traffic filter in your GA property.

If you don’t know your IP address, click the link on the right side.
Step #2. Internal traffic filter in GA4
Even though Google Analytics contains the “internal” filter right out of the box, it’s disabled by default. We will activate it a bit later. But now, you can just check whether you have that filter.
In this list, you should see the Internal Traffic filter. If its current state is Testing, proceed to the next step.
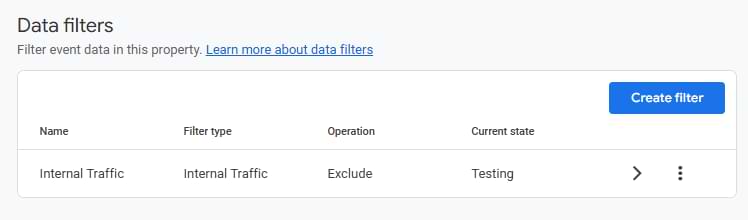
If you don’t see any filters at all, create one. Click “Create filter” and enter the following settings:
- Filter type: Internal traffic
- Data filter name: Internal
- Filter operation: Exclude
- traffic_type: internal (all lowercase)
- Filter state: Testing
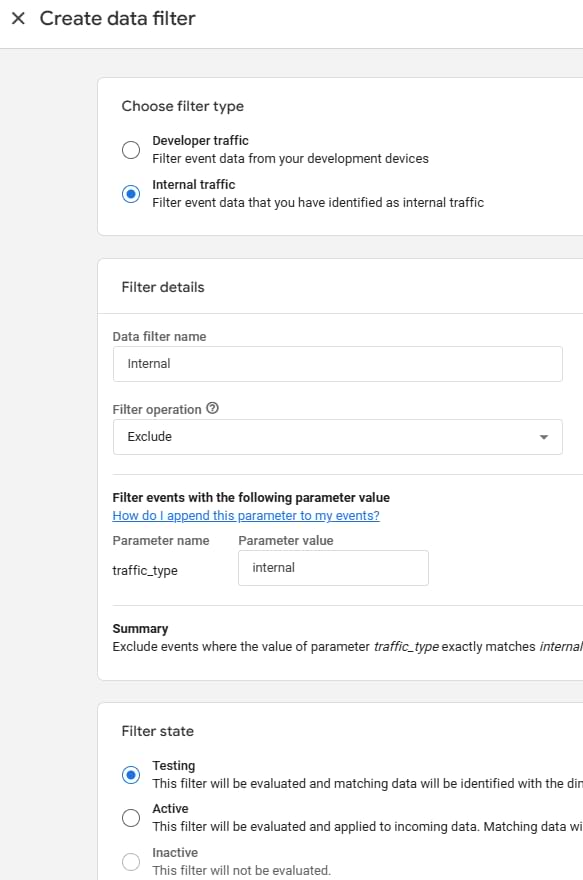
Save the filter.
Step #3. Create a developer filter in GA4
You might wonder what the difference is between a developer filter and an internal traffic filter in GA4. Both of them exclude data from the regular reports in GA4 (by checking different parameters).
The developer filter checks the debug_mode or debug_event parameters while the internal traffic filter looks for traffic_type.
But the key difference here is that you can see developer traffic in the DebugView of GA4, while the internal traffic is not displayed anywhere.
At least, that’s the theory. But I had mixed results here, and sometimes the internal traffic filter gets a higher priority than the developer traffic, and the debug view does not work as a result.
So what can we do here? I’ll answer that in the next chapter. But first, let’s create a developer filter (because it is not ready by default). In GA4, go to Admin > Data Filters > Create Filter. Select Developer Traffic. Enter the following settings:

You can enter any name in the “Data Filter Name” field. Set this filter to Testing (for now). Save it.

Understanding filter states: Testing vs. Active
When you create or edit a data filter in GA4 (like the Internal Traffic or Developer filter), you have two main states: Testing and Active.
- Testing State:
- Purpose: Allows you to verify if your filter rules correctly identify the traffic you intend to exclude without actually removing that data from your reports yet.
- How it works: When a filter is in “Testing” mode, GA4 evaluates incoming events against the filter’s conditions. If an event matches, GA4 does not exclude it but instead adds a special dimension called Test data filter name to that event data. The value of this dimension will be the name you gave your filter (e.g., “Internal Traffic” or “Developer Filter”).
- Verification: You can use this dimension in GA4 reports (like Explorations or by adding it as a secondary dimension in standard reports) to see how much of your traffic would have been excluded if the filter were active. This lets you confirm, for instance, that only your internal IPs are being tagged with the “Internal Traffic” filter name.
- Purpose: Allows you to verify if your filter rules correctly identify the traffic you intend to exclude without actually removing that data from your reports yet.
- Active State:
- Purpose: Permanently excludes data that matches the filter conditions from being processed into your GA4 reports (excluding DebugView for Developer filters, theoretically).
- How it works: Once active, any event matching the filter’s rules is dropped and will not appear in standard reports, Explorations, audiences, etc. This action is irreversible for historical data – once excluded, the data is gone from reporting views.
- Purpose: Permanently excludes data that matches the filter conditions from being processed into your GA4 reports (excluding DebugView for Developer filters, theoretically).
Recommendation: Always leave newly created filters in the Testing state for at least 24-48 hours. Verify using the Test data filter name dimension that the filter is correctly identifying the intended traffic before changing the state to Active.
Step #4. Create a lookup table in GTM to override the traffic_type parameter
This is where the magic will happen. In one of the previous chapters, I mentioned that GA4 automatically adds a tt=internal (traffic_type) parameter to all hits if they come from one of your internal IP addresses.
What we are going to do is to create a Lookup table variable that manipulates the value of the parameter. If we have the GTM preview mode enabled, then we will change the tt’s value to developer (or anything else). But if the Debug Mode is disabled, then we will not do any modifications and let the GA4 handle this.
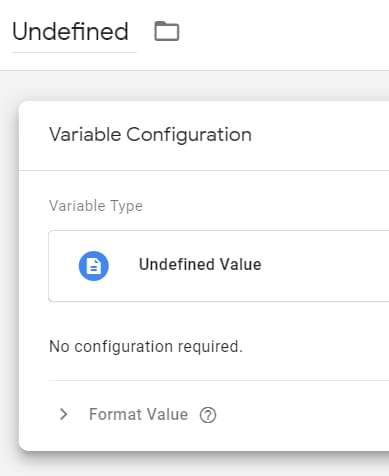
First, create an Undefined variable. In GTM, go to Variables > New > Undefined and save the variable (its name can be, well, Undefined).
Now, let’s go to Variables > Configure (in the Built-in variables section) and enable the Debug Mode variable.
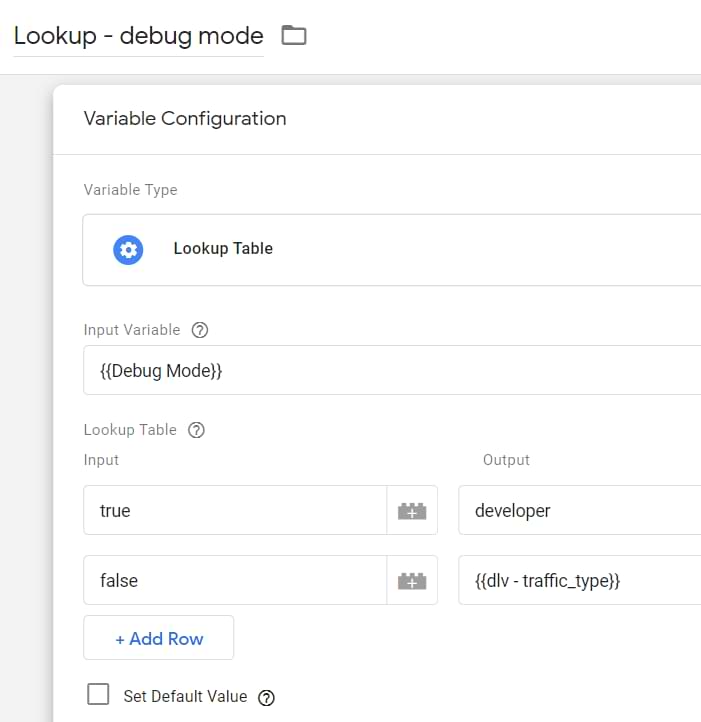
Finally, let’s go to Variables > New > Lookup table and enter the following settings:
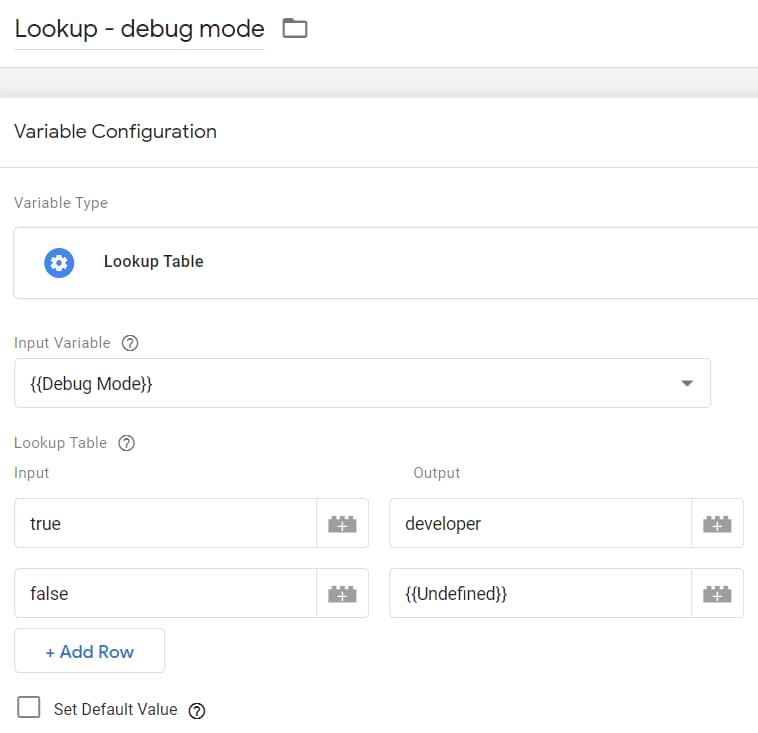
Here we are using the Debug Mode variable as input. If the GTM preview mode is enabled, this variable will return true. Therefore, the lookup table variable will return the word “developer”. The Debug Mode variable will return false if GTM Preview mode is not used. Therefore, we will return undefined. That’s why we created the Undefined variable.
This is not the same as just entering “undefined” in the field. In JavaScript, “undefined” surrounded by quotation marks is a string (text). But undefined means no value. If you enter the word undefined in the Lookup table, that is a string.
Save the variable.
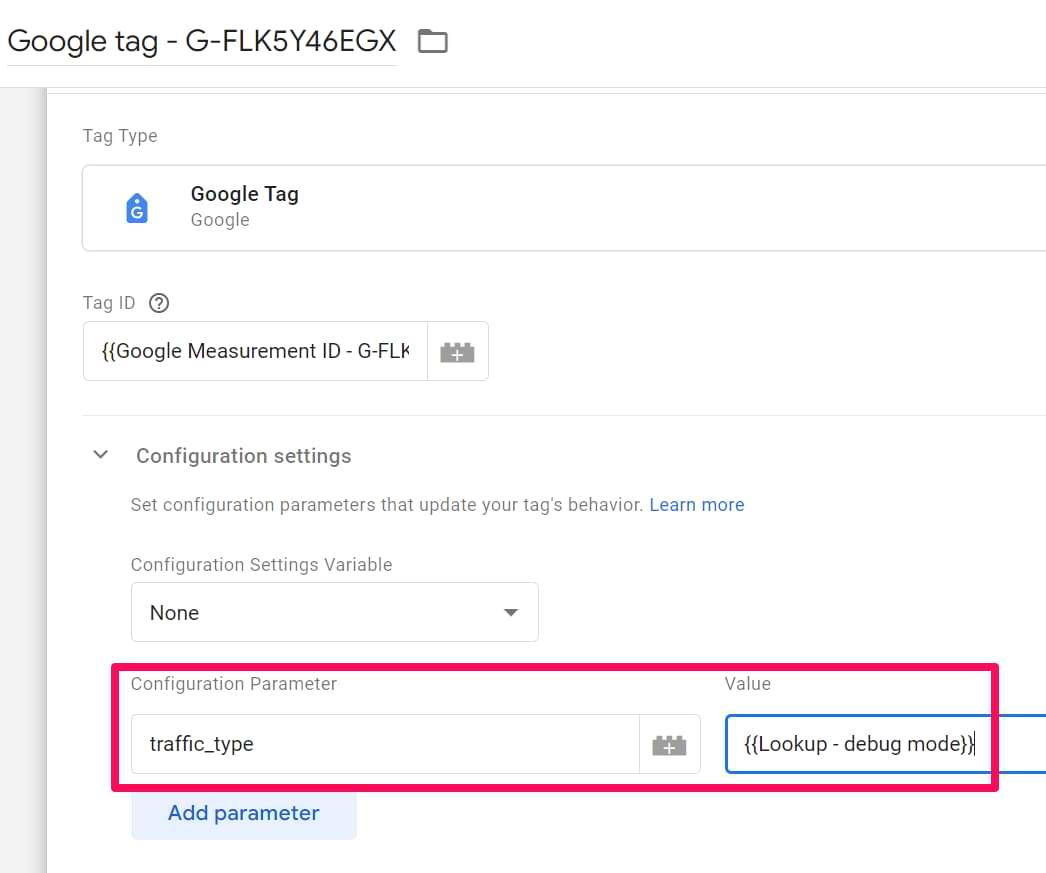
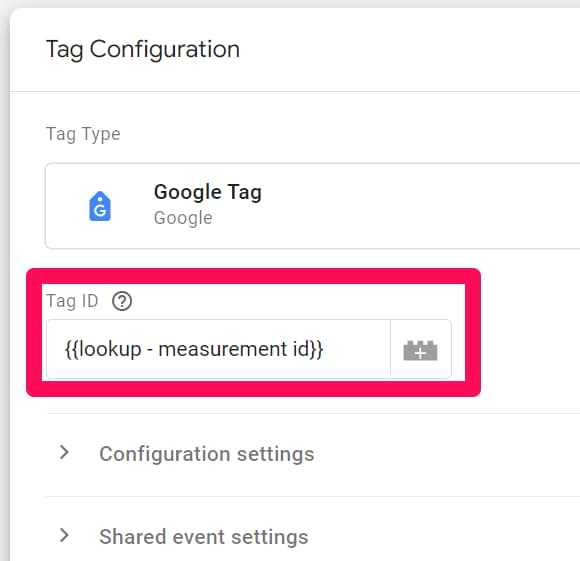
Finally, go to your Google tag and enter the following parameter: traffic_type. And its value should be the lookup table you’ve just created.
Step #5. Test the filters
Now, it’s time to test. Enable GTM’s preview mode. And go to your website (obviously, you should be browsing from the IP address that is configured in the Internal Traffic section of your Data Stream). Go to the DebugView of GA4.
First of all, you should still be seeing hits coming from your device. Click on any event in the event stream and check the parameter traffic_type. Its value should be developer.
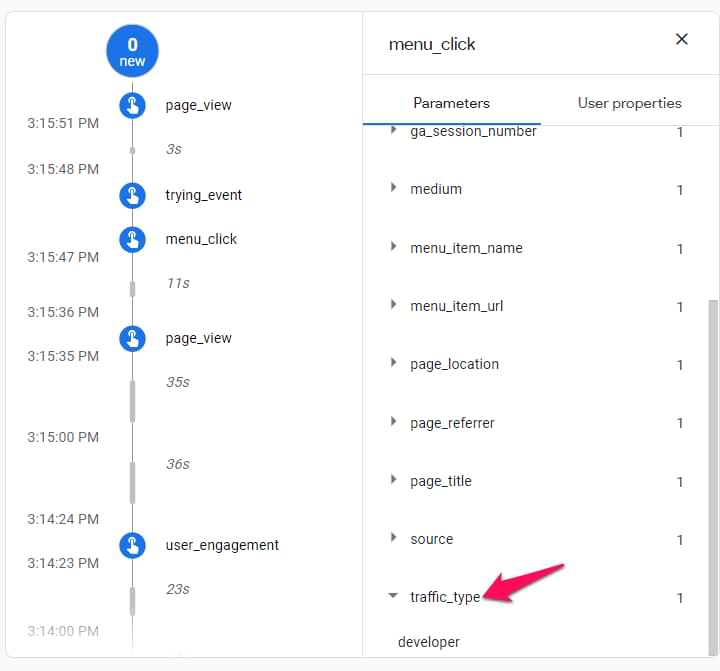
Also, in that same event, you should see the Debug Mode parameter too.
Remember: both filters (developer and internal) are not active yet. They are in testing mode, meaning the soon-to-be-excluded data is still visible in the regular GA reports.
When filters are in the testing mode, an additional dimension is added to them called Test data filter name. You can use it as a secondary dimension (or in Analysis Hub) to check how much of the data would have been excluded if the filters were active. You can also learn more about the filters here.
If this setup with the lookup table variable does not work, then you can consider not using it at all. The bright side of this is that at least your internal traffic will not be polluting standard reports and explorations.
The downside is that the debug view will not work (until GA4 fixes this). To avoid the downside, you could use a VPN service (like NordVPN, etc.) that can temporarily change your IP address. In that case, your company’s internal traffic is still excluded, and only you will be polluting GA4 data (but at least debug view will be working for you).
Alternatively, you can use a separate property for testing. I explain how to do that at the end of this blog post.
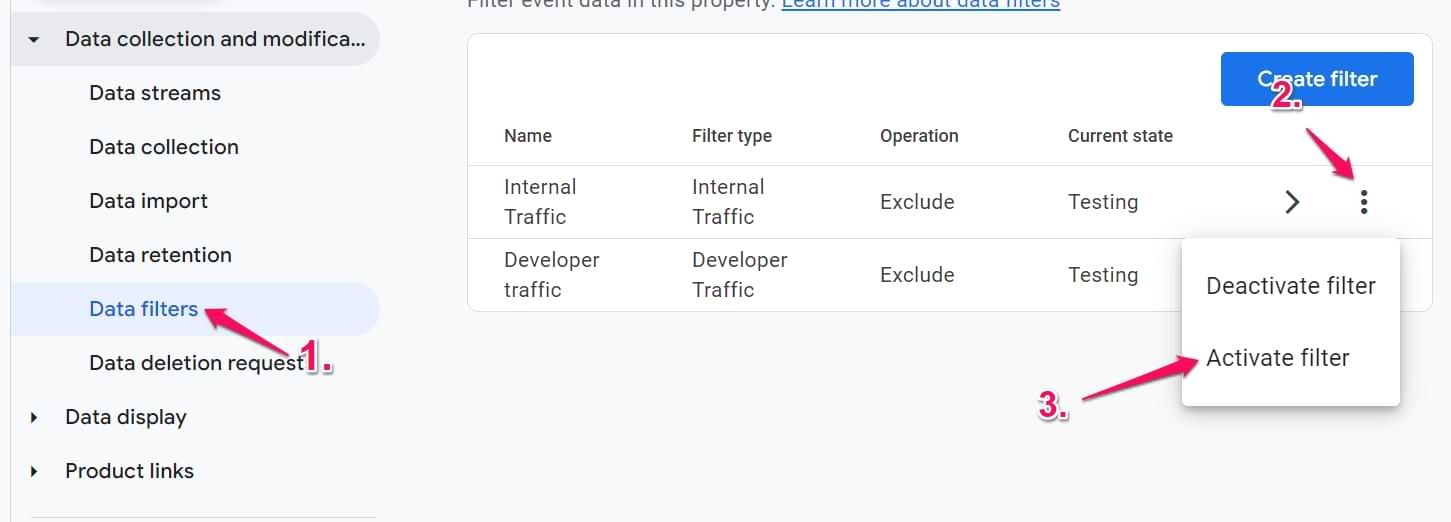
Step #6. Activate both filters
The last step is to activate both filters. Go to Admin (in GA) > Data Filters and set both triggers (Internal traffic and developer traffic) to active. You can do that by opening each filter, changing its Filter state, and then save the changes. Or you can just activate them from the list:
Now, do the test once again.
- Browse from the IP address that is defined as Internal
- Have the GTM preview mode disabled. Browse your website (to send some events to GA4)
- Check the DebugView. You should not be able to find your device and see new events coming from it.
- Now enable GTM’s preview mode. Browse the website once again.
- Check the DebugView. You should now be able to find your device and start seeing some data.
Note on filter order: GA4 applies data filters in the order they appear in the Admin > Data Filters list. While the GTM override method described here is designed to prevent conflicts by making sure traffic is marked as either developer OR internal (when not debugging), it’s generally good practice to be aware of filter order if you create additional custom filters later.
In our case, the relative order of the default “Internal Traffic” and our created “Developer Filter” shouldn’t impact the outcome if the GTM override is working correctly.
However, if you experience unexpected behavior, you could experiment with reordering them (using the three dots menu next to a filter), although it’s unlikely to be the primary issue with this specific setup.
Method #2 – excluding internal traffic with the data layer
Another method does not involve IP addresses. Maybe your developers can identify somehow that the visitor/user who’s now browsing your website/web application is internal? Maybe they can identify that by a user id, or maybe they can think of something else? Talk to them.
Step #1. Getting the internal data parameter into the Data Layer
If that is possible, you should ask them to push the user_type (or traffic_type, or whatever) parameter to the data layer that could help you identify that the visitor/user belongs to your own company. If a visitor belongs to your company, then the parameter’s value should be internal. If a user/visitor does not belong to your company, no dataLayer.push should happen.
Here’s a sample dataLayer.push code that your developer could activate if the user/visitor belongs to your company:
<script>
  window.dataLayer = window.dataLayer || [];
  window.dataLayer.push({
    'event': 'traffic_type',
    'traffic_type': 'internal'
  });
</script>
The event key is not required (but recommended). This code must be activated before the GTM Container snippet is loaded.
Then create a Data Layer Variable with the following settings:

Step #2. Create a developer filter in GA4
In GA4, go to Admin > Data Filters > Create Filter. Select Developer Traffic. Enter the following settings:
Set this filter to Testing (for now). Save it.
Step #3. Create a lookup table in GTM to override the traffic_type parameter
Go to Variables > New > Lookup table and enter the following settings:
Here we are using the Debug Mode variable as input. If the GTM preview mode is enabled, this variable will return true. Therefore, the lookup table variable will return the word “developer”.
If GTM Preview mode is not being used, the Debug Mode variable will return false. Therefore, we will return the value of the Data Layer Variable that you created in the first step.
If the data layer contains the traffic_type key, then its value will be sent to GA. If the key does not exist, then it will be set to undefined (meaning that GA4 will not send the traffic_type key at all).
Save the variable.
Finally, go to your Google tag and enter the following parameter: traffic_type. And its value should be the lookup table you’ve just created.
Step #4. Test the filters
Follow the same process as I have described here.
Step #5. Activate both filters
The last step is to activate both filters. Go to Admin (in GA) > Data Filters and set both triggers (Internal traffic and developer traffic) to active. You can do that by opening each filter, changing its Filter state, and then save the changes.
Or you can activate them from the list:
Then test everything once again (as I have described here).
Method #3 – excluding internal traffic based on a cookie
Another possible way to exclude internal traffic in Google Analytics 4 could be by using a cookie. You tell your employees to visit a certain unique URL, then you set a cookie with GTM and use its value in the lookup table variable.
Step #1. Set a cookie for internal users
However, keep in mind that just like any other method mentioned in this article, this one has its flaws. If most of your employees are using Safari (or browsing with iOS), the Intelligent Tracking Prevention will limit the lifetime of a cookie, and your employees will have to revisit that unique link often.
Let’s say that your website’s URL is www.mybusiness.com. Then you can tell your employees to visit the following URL: www.mybusiness.com?internal_user=true
Then go to Google Tag Manager and create a Custom HTML tag, paste the following code inside of it:
<script>
(function(){
 var cookieName = "gtm_internal_user"; // Name of your cookie
 var cookieValue = "internal"; // Value of your cookie
 var expirationTime = 31104000; // One year in seconds
 expirationTime = expirationTime * 1000; // Converts expirationtime to milliseconds
 var date = new Date();
 var dateTimeNow = date.getTime();

 date.setTime(dateTimeNow + expirationTime); // Sets expiration time (Time now + one month)
 var date = date.toUTCString(); // Converts milliseconds to UTC time string
 document.cookie = cookieName+"="+cookieValue+"; SameSite=None; Secure; expires="+date+"; path=/; domain=." + location.hostname.replace(/^www\./i, ""); // Sets cookie for all subdomains
})();
</script>
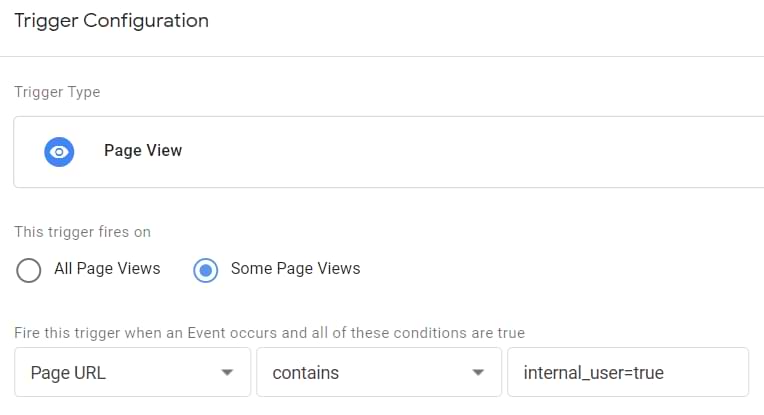
Set this tag to fire on a Pageview trigger when Page URL contains internal_user=true.
Step #2. Cookie variable
Go to GTM > Variables > 1st Party Cookie and enter the following settings:
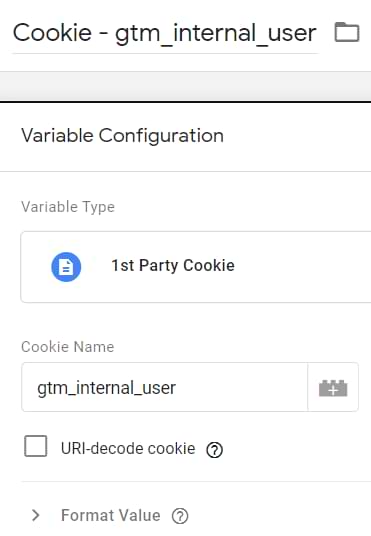
Save the variable
Step #3. Create a developer filter in GA4
Create a developer filter in GA4, just as I have explained here.
Step #3. Create a lookup table in GTM to override the traffic_type parameter
Go to Variables > New > Lookup table and enter the following settings:
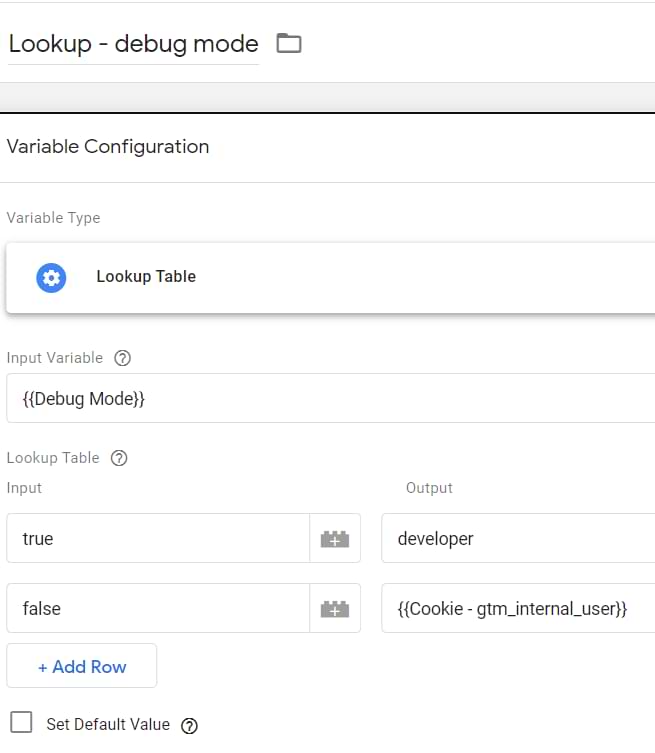
Here, we are using the Debug Mode variable as input. If the GTM preview mode is enabled, this variable will return true. Therefore, the lookup table variable will return the word “developer”.
If GTM Preview mode is not being used, the Debug Mode variable will return false. Therefore, we will return the value of the 1st Party Cookie Variable that you created in the first step. If the cookie exists, then its value will be sent to GA. If the cookie does not exist, then it will be as undefined (meaning that GA4 will not send the traffic_type key at all).
Save the variable.
Finally, go to your Google tag and enter the following parameter: traffic_type. And its value should be the lookup table you’ve just created.
Step #4. Test the filters
Follow the same process as I have described here.
Step #5. Activate both filters
The last step is to activate both filters. Go to Admin (in GA) > Data Filters and set both triggers (Internal traffic and developer traffic) to active. You can do that by opening each filter, changing its Filter state, and then save the changes.
Or you can activate them from the list:
Then test everything once again (as I have described here).
How to test your internal traffic exclusion setup
Regardless of the method chosen (IP, Data Layer, or Cookie), follow these steps rigorously before activating the GA4 filters. Perform tests from a known internal identifier (IP, logged-in status, or after setting the cookie).
Phase 1: Filters in “testing” mode
- Enable GTM Preview Mode: Start GTM Preview for your website.
- Verify traffic_type=developer:
- Go to GA4 DebugView. Find your device.
- Trigger some events (page view, clicks, etc.).
- Click on an incoming event in DebugView. Check its parameters. You should see traffic_type with the value developer. You should also see a Debug Mode parameter.
- Confirm you can see your events in DebugView.
- Disable GTM Preview Mode: Close the Preview mode tab and the debugged website tab.
- Verify traffic_type=internal (or absent):
- Open your browser’s Developer Tools (usually F12) > Network tab. Filter for collect?v=2.
- Browse your website normally (from the internal identifier). Trigger some events.
- Inspect the outgoing GA4 requests in the Network tab. They should now include tt=internal (if using IP definition or correctly identified via Data Layer/Cookie) OR the traffic_type / tt parameter should be absent if you are not identified as internal (e.g., browsing from a different IP or without the cookie).
- Check GA4 Reports (Test Dimension):
- Wait at least for a day (data processing delay).
- Go to GA4 Reports or Explore.
- Add the secondary dimension Test data filter name.
- You should see traffic split between filter names (e.g., “Internal Traffic”, “Developer Filter”) and “(not set)”. This confirms the filters would apply if active.
Phase 2: Filters in “Active” Mode
- Activate Filters: In GA4 Admin > Data Filters, set both the Internal Traffic filter and Developer Filter to Active. Wait 10-30 minutes for changes to apply (can be unpredictable).
- Test Debugging: Enable GTM Preview Mode again. Browse the site. Check GA4 DebugView. You should still see your events (because traffic_type is now developer).
- Test Exclusion: Disable GTM Preview Mode. Browse the site normally from the internal identifier. Check GA4 DebugView. You should NOT see your device or any new events coming in. Check Realtime reports too – your activity should be absent.
If all these tests pass, your setup is likely working correctly. If DebugView stops working in Step 2 (Active Filters + Preview Mode), there might be a GA4 bug or delay.
Send internal data to a separate GA4 property
This is optional, but if you want, you can send the internal data to a separate property (instead of playing with the traffic_type parameter as we did above). I won’t be explaining this step-by-step. Instead, I will explain a general overview and will leave this for you to play around with.
Basically, you can create a lookup table variable that will pick the correct GA4 measurement ID based on some variable that indicates internal traffic. So, let’s say that you have a cookie variable Cookie – internal traffic, and its value is true if the visitor is one of your coworkers.
In that case, go to GTM > Variables > New > Lookup table and enter the following settings:
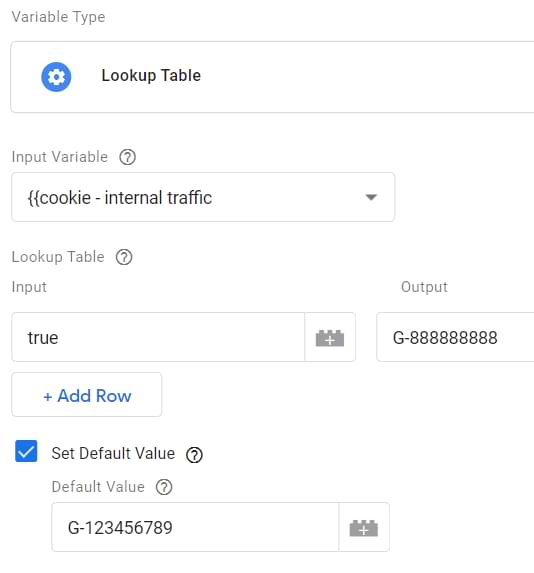
If the cookie variable’s value equals true, then it will return the measurement ID of a test property (by the way, you should create a separate GA4 property for this). In all other cases, the variable will return your “LIVE” property’s measurement ID.
The final step is to insert this lookup table in your Google tag.
Pros:
- Complete separation: Internal data never mixes with production data, ensuring clearer data in the main property.
- No filter bugs/delays: You avoid potential inconsistencies or delays associated with GA4’s data filters. DebugView on the test property should always work for internal users (as no filters are needed there).
- Clear distinction: It’s very clear which property holds which type of data.
Cons:
- Requires extra property: You need to create and manage an additional GA4 property solely for internal traffic/testing.
- No holistic internal view: Analyzing internal user behavior requires looking at a separate property; you can’t easily compare internal vs. external segments within the same interface.
- Potential configuration complexity: Managing the Lookup Table and making sure the correct Measurement ID is always used requires careful GTM setup and maintenance.
This method offers a cleaner data split but comes with the overhead of managing a separate property.
Exclude Internal Traffic in Google Analytics 4: Final words
The main benefit of how I exclude internal traffic is that it is still visible in the DebugView as long as you have the GTM Preview mode enabled. That way, you can debug your incoming hits without the need to do some manual hacks to overcome the traffic_type=internal.
Keep in mind that none of the aforementioned solutions are perfect:
- IP-based filters won’t work if your employees have dynamic IP addresses
- dataLayer.push-based filtering requires the developer’s input + still can miss some employees who browse anonymously-ish and haven’t logged in anywhere, so that your developer could identify them
- The cookie-based solution is, well, based on cookies. Cookies cannot be shared across multiple devices of the same visitor. Cookies can be cleared. Cookies expire sooner because of ITP on iOS or Safari. Thus, your employees might need to regularly revisit that unique URL (that sets the cookie).
I really hope that my experiments with filters were correct and that if you indeed exclude your internal traffic, it is not displayed in the debug view (until you do the modifications with the lookup table). If, on the other hand, you see that I’m wrong, please let me know, and I’ll update the guide accordingly.
66 COMMENTS
Thanks for the article. Is there any custom way to exclude your own domain from referrals now in GA4?
I am not aware of any *solid* way to do that.
Hi Julius, nice Guide as always, one question arises here, is the traffic_type parameter bond to the single page view event, the actual session, or to the user? my guess is that mark the traffic as internal only on the pageview with such parameter, would it be possible to set it as "user property"? to exclude that user as long as cookie allow us from analytics report, thank you.
I am not sure. But as long as you set it in the config tag and all other tags use that config tag, the parameter is applied to all events.
Well, that's for sure, it will exclude the whole session from being counted in Analytics, I was more wondering if it is possible to exclude a user across multiple sessions, setting the traffic_type as "user property", it should exclude him in a "native" way without dealing with extra cookies or local storage workaround.
No such way at the moment.
Thanks
Thank you for this article!
I implemented "Method #1 – excluding internal traffic by IP address" and it was working last week. But for some reason when I went back today, I wasn't able to see myself in debug mode anymore. Do you know if GA4Property made new changes?
Not sure. I'll keep an eye on this.
Hi Julius, I have at least 15 different IPs at least to filter out... how do I go about excluding those.. there is no regex method as of now
Then use the non-ip solutions from my blog post.
Does this mean that the dropdown conditions within the filtering are AND and not OR? And you cannot list out all 15 IP addresses within one filter using the different condition dropdowns?
You can. But in case IP addresses are constantly changing, then use non-IP solutions.
I'm not sure this makes sense as an answer to my question. My IP addresses are static, but I have more than 10 that I need to filter (which is beyond the limit in GA4). With that being said, could I use the match type of "IP address contains" and list out all of the IP addresses with "|" or ",". Or will that not work because the match type condition is AND and cannot be used for "OR" for unique values? I hope that makes sense!
PS - tried to filter the IP addresses in GTM and couldn't get that to work correctly either as I believe a developer is needed to push the dataLayer event to collect the IP. I cannot get the event to load when it needs to.
Hi!
Yesterday I used the Method 1. Everything was great: I filtered out my IP, but received developer value.
But today I cannot see myself in GA4 Debug: I changed nothing from yesterday. I checked whether all setting are active - yes, evth is good as I did. But cannot see in Debug view...
I couldn't find good reference info on google yesterday when I set this up, and wound up getting it to work by setting the traffic_type param in the config call. I tested it in debug mode with the google tag assistant the browser (not debug view in google) and the initial call and all the subsequent calls seem to be sending the tt=internal param. Our setup is using this as a fallback to the IP filter because some of our internal users login from remote IP's, and we can identify that and set them as internal once they login.
gtag('config', 'G-123456789', { 'traffic_type': 'internal' });
Hi Julius, thanks for the guide. I have implemented according to your guide, with the traffic type set to "developer" when debug mode is true (1). But I can not see debug traffic in Debug view. I can't see my debug traffic if I only have the "developer traffic filter" active.
Does someone know if "Developer filter" is supposed to work? (exclude debug traffic except for debug view report)
Something weird is happening with the filters in GA4 + DebugView. They used to work better, now I see more people struggling with it. Hopefully, this will be fixed by Google.
Many thanks for providing this article.
I am using your Method 1 (Internal & Developer filters with a Lookup Table). I gather from this article that the lookup table is needed to allow developer traffic to be visible in debug mode. But I also see that Google's own advice says "If you exclude developer traffic via a filter, you can still see it in DebugView" (see https://support.google.com/analytics/answer/10108813).
So is the lookup table still needed?
Yes, I saw that. But the developer filter did not work for me, so I had to use a lookup table.
Sorry. Just realised that my question is already answered in your article where you say that if we use "both the debug_mode and traffic_type=internal, then the internal traffic parameter gets a higher priority and you won’t be able to see your hits in the DebugView."
Hi Julius. I'm using the cookie method as my IP is dynamic. However, you mentioned to activate both filters (Internal and Developer). Why should activate the Internal if I didn't define any IP??
Because the internal traffic's filter check the "traffic_type" parameter and if its value is "internal", then the filter will work. However, I have noticed that in the article, the cookie's value was incorrect. I have now updated the code of that chapter and you should update your setup too.
Hello, Julius!
Thank you for such a detailed tutorial! That's a huge work!
We filter traffic with cookies and after the update to GA 4 the old filters stopped working.
I tried the third solution from your article and it looks like it doesn't work for me at all. It filters traffic for debug view only and it shows tt: developer, but as soon as I switch off debug mode, it doesn't have any tt property any longer. I tried the second solution with the same result (it has the data layer traffic_type: internal, but it has no tt property in the request and it doesn't filter traffic).
It looks like it just doesn't send the traffic_type property at all.
Is there anything could be missing? Or could it be any corner case for GA4?
Hi Olga, did you find a solution to your issue? I have the same one so that not in a debug mode there is no tt.
Hello Julius,
Please does any of these methods work for excluding external traffic from APP DATA STREAM?
Not directly. But you could aak devs to send traffic_type=internal from your app
Hi Julius,
I created an account with only GA4 and a Tag Manager Workspace for GA4 configuration and cookie internal traffic. Now I want another property on Analytics only Universal, if I create another Tag Manager Workspace exclusively dedicated to Universal property (with tracking event, goals, ecc.) they go into conflict?
Thanks in advanced.
You cannot create a permanent workspace in GTM. Once you publish it, it will disappear and will be merged into the main container. Having GA4 and UA in a single GTM container is not a problem.
Hiya, After following your steps I think I have set this up correctly. I have done this so I can exclude traffic from our companies headquarters but still be able to use the debug mode on GA. I have just activated the filters and gone into my debug mode, I am still receiving hits but the traffic_type says 2: Developer and Internal. Is this a problem? I'm not quite sure what it means.
Thanks very helpful article!
It also doesn't seem to be excluding my IP from GA as I can see 1 user active in my location.
Method 1, Step #3 is a bit confusing. How did you go to
"Variables > Customize (in the Built-in variables section) and enable the Debug Mode variable"?
I can't see a "customize" in the variable?
Can you please confirm if this tutorial still has the same interface for the current GTM interface?
thank you
Sorry, buttonname is Configure, not customize. Fixed it.
Thank you.
Does it work right away when testing? or should i wait 24 hours for this to work?
I check debug view in ga4 but it says "Waiting for debug events" :/
Thanks, Julius, for as always amazing tutorial!
I work in a company, so all employees use the same (internal) IP. Does implementing of Developer filter mean that I'll be seeing THEIR events in my Debug Preview? If yes, how to overcome it?
No, you will see their events only if they use GTM preview mode, or GA debugger extension. Or you have configursd debug_mode parameter
Hey Julius, Thank you so much for this. I have purchased your GA4, GTM course as well and it is fantastic. I have a question. I followed the guide here and implemented the cookie version. Is there a way to view stats on the internal traffic in reports? We have a large company and would like to view some usage stats from our internal users.
Thank you!
If filter is active, that data is gone. I would personally recommend sending data to a separate GA4 property if a visitor has a cookie of an internal traffic
Thank you so very much. that makes sense!
I have GA4 setup and would like the property to keep ALL data and a subproperty which will only show data that is filtered out internal traffic..
In this way I can compare ALL and Internal traffic.
Anyone know if this is even possible (similar setup exists in UA)
All guides seem to only show filtering internal traffic at property level. Thank you.
Hy Brad,
there's no way to compare data for a GA4 property and its sub-property in the GA4 web interface itself. However, you can load both data sets into Looker Studio as a Blended dataset and make any comparisons there.
Here's my example for GA4 internal traffic comparison within the same GA4 property. You don't have to use sub-properties for this.
https://www.linkedin.com/pulse/filtering-internal-traffic-ga4-self-id-without-ip-addresses-basrak
Can you filter out internal traffic by query parameters?
I have some internal traffic that always has "mw_preview=1" in the URL.
Is it possible to filter it based on this?
Hey Julius, a quick one - I have my Internal & Developer filters Active (as well as the look up table variable implemented following your guide) and everything is working as expected.
In Realtime report, all the hits (of course with the traffic_type=internal/developer) are being shown as well. Is this expected/correct?
I thought making the filter Active would exclude this traffic from all reports including Realtime.
Great stuff - learning loads about GA4 :)
I have a (possibly silly) question: Would using a VPN to change your IP and clearing the cookie cache on your browser enable your device to appear in the Debug Mode when testing?
Hi Julius,
Is there a way to create a custom dimension from a URL? I need to track a multilanguage website. The language is in the url es. www.example.com/de . Is there a way to extract this value in order to filter and isolate traffic and information of user who interact only with the german website?
Thanks in advance
Hello, is there any way now to exclude internal traffic (not IP, I mean >> source) from GA4 reports. Developers installed Sniperfast Instant Search on PrestaShop and now we have 70% of revenue included in source/medium >> sniperfast / search
Are the steps in this webpage enough to set up an internal IP filter? https://support.google.com/analytics/answer/10104470?hl=en There seems to be a lot of additional steps in this article here. From what I can tell, the latter is aimed at trying to get Debug view to keep working since it stops working once you add an internal IP filter. So if one is okay with Debug view not working, we can skip the 2nd article?
Yes
I unfortunately cannot get the cookie method to work. I've been trying every article I can and it still is tracking my internals even when they use the special URL. I have followed all the steps in the last method (only for the internal traffic filter active, as I did not need a debug view). Please let me know if there is anything I can do.
Hi Julius. You're content is always so thorough and helpful.
I have a basic question I hadn't considered before, although it's probably a pretty basic thing! Would this filter also filter out any revenue and transaction detail from internal purchases?
We have an internal IP filter, on our UA instance but not yet on GA4. We are trying to get basic revenue variances between UA and GA4 to an acceptable level (currently around 10% variance) and this issue of filtered data within UA came up.
Thanks for all the content!
Been following for a couple of years now and alway come back whenever I have issues regarding GA4/GTM
Question:
Currently running campaigns for a local business and the service area where I am is rather small so I'm worried using the public IP will filter out data from other local users.
Is there a way to do this? Could the private IP work?
Thank you!
Hello, I have a separate Test property set up for the QA site where testing is done. I have created a look up table and identified Live and Test properties, so it separates the traffic. Do I need to follow any other step as mentioned above?
Can I use this method to filter out RuxitSynthetic - Synthetic monitor traffic from GA4? We use these synthetic monitors to monitor website health.
I have created a JS GTM variable - navigator.userAgent, not able to move past this step. What TAG/event should I create now? and how do I set filter in GA4? Can you guide?
Hi Julius:
Another helpful post - your courses have been worth every penny to me! Even when I google "how to" something bGA4 or GTM related, whatever I end up on that's ultimately helpful is usually a page of yours.
May I ask a question about this? I got option 2 working with the trigger watching for Page URL containing "?internal_user=true". But I wonder if I could do the same thing, but have the Page URL watch for "wp-login.php"? (I tried this and it didn't work, but maybe you know how...).
My reason for this desire is that I can't rely on everyone involved in the multiple sites & accounts I manage to visit a special URL to log in.
Thanks!
Is google analytics opt-out addon a good alternative as well?
sure
Is there any downside to having 2 separate GA4 accounts and firing both the tags on our website? That way we could set up an internal traffic filter on one of the properties but not the other.
In UA we could apply an IP address filter per View, so it was easy to have one View with all data and a separate View (as part of the same property) without internal traffic. Trying to replicate that option here, as sometimes it's nice to have a complete view with all the visits (including staff).
Hi Julius, thanks for the article!
I've implemented the IP method described here, but once I activate Debug Mode, I can see my data both in Debug view and real time reports. Do you have any ideas why this may be happening? Thanks in advance!
For a quick and easy solution for small WordPress publishers:
1. Install the Site Kit plugin.
2. Connect it to Google Analytics.
3. Go to the plugin settings and enable “Exclude from Analytics: All logged-in users.”
This will prevent Analytics from tracking logged-in users. After logging out of the WordPress dashboard, you can immediately see your activity in GA4’s Debug View and GMT’s Preview Mode. When you log back in, GA4 will stop collecting your own data.
Hope this helps!
Thank you very much for your post, Sofia. I was playing for a few days with GTM because I couldn't see any movement in the Debug View. I installed Site Kit, but I didn't notice that it's set to exclude traffic from logged-in users XD
I’ve set up cookie-based method explained in this article to filter out internal traffic in GA4. While my own visits no longer show up in the Debug View, the pages I visit are still appearing in the Real-Time Overview report.
Both filters (Internal Traffic and Developer) are active. Is it normal for internal traffic to still show up in the Real-Time Overview?
Hello Julius,
I am using method nr. 1 with Lookup table variable with developer and internal traffic filters active, but my events are now showing in real time reports.
This method worked for the past year, so I'd like to know if something changed over the past year in GA4?
Hi, tried it. Worked really well.
Hi Julius
Is this method valid also for a remote settings using VPN?
I use method #1 to exclude internal trafic but it stopped working after I implemented Google tag gateway for advertisers https://developers.google.com/tag-platform/tag-manager/gateway?hl=en with Cloudflare https://developers.cloudflare.com/google-tag-gateway/.
It seems related to this issue: https://community.cloudflare.com/t/ga4-internal-traffic-filter-not-working-with-google-tag-gateway-cloudflare/818976
Do you have any guidance on that?
Thanks
I'm working with a client who has a client portal that is not tagged for GA4, so traffic isn't tracked. However, there is a link to the portal on their primary website, and we suspect based on traffic patterns that a high percentage of clients never bothered to bookmark the portal, and instead go to the website and click to the portal from there. We would like to exclude those visits from GA4 reports. Is there a way to identify those visitors based on an outbound click, and then exclude them, without requiring a developer's help?