
July 1, 2025
How to Build a GA4 Funnel with BigQuery and Looker Studio?
The funnel explorations in Google Analytics 4 enable you to analyze the completion and abandonment rates along a pre-defined user journey, which can help you identify bottlenecks in specific paths on your site. Identifying obstacles along these paths can help improve the user experience by pinpointing areas where users encounter difficulties.
However, there are some limitations to the built-in funnel explorations in GA4, such as not being able to filter the report to only show actions taken in the same session and the inability to break down the entire funnel by more than one dimension.
In this article, we will go through how you can build a GA4 funnel with BigQuery, allowing for much more flexibility and customization, and then we’ll visualize the funnel in Looker Studio.
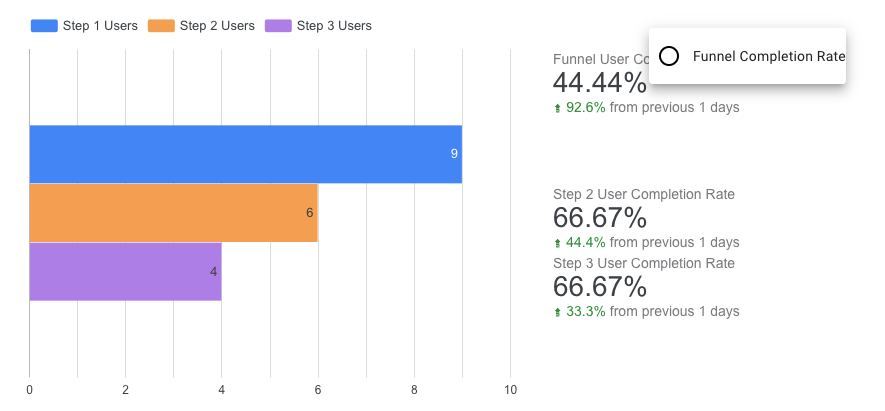
Table of Contents
Here’s what you will learn in this article
- Key limitations of funnels in GA4
- Assumption
- Build a GA4 funnel with BigQuery
- Example 1: Basic 3-step funnel with no breakdowns
- 3-Step Funnel: Adding in all the fields we need
- 3-Step Funnel: Step 1
- 3-Step Funnel: Join Step 2 to Step 1
- 3-Step Funnel: Join Step 3
- 3-Step Funnel: Remove unnecessary fields from the output
- 3-Step Funnel: Save data to a table
- Example 2: Two-step funnel with breakdowns
- 2-Step Funnel: Adding in all the fields we need
- 2-Step Funnel: Step 1
- 2-Step Funnel: Join Step 2 to Step 1
- 2-Step Funnel: Remove unnecessary fields from the output
- Visualize BigQuery funnel with Looker Studio
- Final Words

Key limitations of funnels in GA4
Why bother building GA4 funnels in BigQuery when they’re available in the interface? I have found that there are some key limitations to the funnels you can create in the Exploration tool.
Time restraint
If you don’t set a time restriction, the default way that Google creates a funnel is by looking at whether a user completed the subsequent actions at any point in the time period. If your time period is, for example, the entire month of June, this can be misleading. Just because a user completed one step on June 1st doesn’t mean it influenced their next action on June 30th
While you can use the time constraint feature on each step to define the user journey, in BigQuery, you can also specify that all actions must occur within the same session or on the same day, not just within a defined time window (although you can do that too).
Breakdown feature
In my opinion, the breakdown feature in the interface has some limitations. You can only apply one breakdown dimension across all steps. In contrast, BigQuery provides much more flexibility. You can include multiple dimensions and even use different dimensions for each step.
For example, you might break down the first step by the UTM campaign that brought the user to your site. Then, if step 2 involves the user performing any of the three different events, you can break down that step by the event name.
Metrics and steps
In GA4, the funnel exploration will only show the user count. This can be limiting if you want to calculate metrics, such as click-through rates, based on event counts, which can be done with BigQuery.
While not a big deal for many, there is a ten-step limit for funnels in GA4, which can be avoided using BigQuery, but that probably goes beyond what most people will ever need for a single funnel.
BigQuery enables you to add or remove any information as needed, allowing for full customization of your funnel, even beyond what is covered in this article.
Assumption
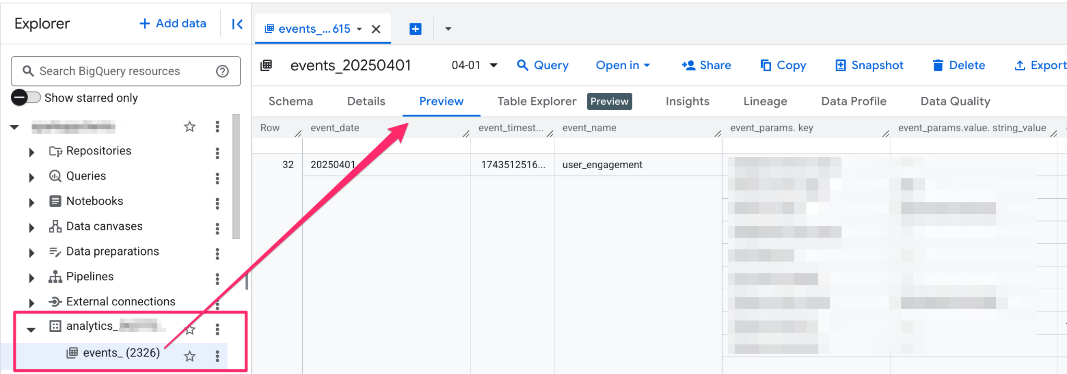
For the remainder of this article, I will assume you already have BigQuery set for your GA4 property. If not, refer to this Google documentation.
Having a basic understanding of the data will also be helpful, as it will enable you to identify the fields you can pull into your queries. I recommend exploring the data using the Preview tab.
Build a GA4 funnel with BigQuery
Before building out the funnels, you’ll want to define the steps you need for your funnel. These can be based on any possible fields, e.g. the event name, the page URL, UTM parameters (or any combination of them), etc.
Base this on your business needs. Ask yourself, what data do I need to measure success? Funnel analyses are all about creating a predefined path that you expect users to follow and determining if the user journey is successful. If you notice a significant drop-off in users at a particular step, consider investigating and making updates to your site. You get the gist!
In these examples, we will walk through a basic three-step funnel that doesn’t have any breakdowns and then examine a more complex two-step funnel where we break down both steps by a different dimension.
Example 1: Basic 3-step funnel with no breakdowns
This will be a three-step funnel that follows when a user lands on the homepage (page_location filter), searches (event_name filter) and then adds an item to their cart (event_name filter) within the same session, with no breakdowns to keep it a simple example to start with. We will also include both a user count and an event count for each step.
3-Step Funnel: Adding in all the fields we need
To build this, we will reference all the daily event tables in the GA4 export dataset and use a filter to extract only the dates of interest. We’re going to build this out in steps, so we’ll start with adding in all the fields we will need.
select
   parse_date('%Y%m%d', event_date) as date,
   event_timestamp,
   event_name,
   user_pseudo_id,
   (select value.int_value from unnest(event_params) where key = 'session_id'),
   (select value.string_value from unnest(event_params) where key = 'page_location'),
   concat(user_pseudo_id, cast(event_timestamp as string)),
from `project.dataset.table.event_*`
where _table_suffix between '2025-04-01' and '2025-04-30'
Let’s break down each line in this prep query. The fields that you must include for any funnel are:
- parse_date(‘%Y%m%d’, event_date) as date: This gets us the date in a nice readable format, e.g. “2025-04-01”. This is the date the user completed the event.
- event_timestamp: This is the date and time in microseconds at which the event was logged in GA4. We will need this to define the order of our steps, e.g., the user visited the homepage before searching.
- user_pseudo_id: This field has two purposes. We will use it to count the number of users at each step and also to join our steps together.
- concat(user_pseudo_id, cast(event_timestamp as string)): In addition to the user count, we will also include an event count. To do so, we will use this concatenation as a unique identifier for a completed event.
I’ve also included fields that might not be necessary for every funnel, but I need them for this specific funnel:
- (select value.int_value from unnest(event_params) where key = ‘session_id’): Since we want to restrict this funnel by users who completed these steps in the same session, we will use the session ID to join our steps together. You can use different time constraints, which is why this may not always apply to every funnel.
- event_name: This is just the event name. We need this to define two of our steps: the search and adding an item to the cart.
- (select value.string_value from unnest(event_params) where key = ‘page_location’): For this funnel, the first step starts with the user landing on the homepage, so we will need to use this as a filter.
3-Step Funnel: Step 1
Now, we will customize this query so that it’s specific to step 1 of the query. We’ll add steps 2 and 3 to this query a bit later. However, as this may be new to many of you, we’ll build out the individual parts and then combine them all together.
select
   parse_date('%Y%m%d', event_date) as date,
   event_timestamp as step1_event_timestamp,
   event_name as step1_event_name,
   user_pseudo_id as step1_user_pseudo_id,
   (select value.int_value from unnest(event_params) where key = 'session_id') as step1_session_id,
   (select value.string_value from unnest(event_params) where key = 'page_location') as step1_page_location,
   concat(user_pseudo_id, cast(event_timestamp as string)) as step1_unique_event_id,
from `project.dataset.table.event_*`
where _table_suffix between '2025-04-01' and '2025-04-30'
and regexp_contains((select value.string_value from unnest(event_params) where key = 'page_location'), r'/homepage')
So, what did we add?
- as step1_: I’m using as so I can rename the field to something that is more clearly defined. We want to be able to tell which fields are related to which steps, so we want to prefix each field with the step number. We will only include one date field, so it can remain without any prefix.
- where regexp_contains((select value.string_value from unnest(event_params) where key = ‘page_location’), r’/homepage’): Each line of the query is important, but the filter might be the most important. This is where you define the first step the user needs to complete to be included in the query. Remember, this can be anything you want!
3-Step Funnel: Join Step 2 to Step 1
Now, we make our first join. This is where things start to get a bit more complicated. Here, we use a left join because we always start with a base population, aka users who completed the first action. A left join ensures that all these users remain in the dataset, even if they didn’t complete subsequent steps.
Once you get the flow of how to do the left join, each step you add is just following the exact same pattern!
The key points are:
- Add any additional fields you want to output to the select statement
- Filter the data you are joining by what you need the next step to be, and the same date range as the previous step
- Make sure that your join conditions are set properly (same user, same session, and the event happened after the first event)
select
   parse_date('%Y%m%d', event_date) as date,
   event_timestamp as step1_event_timestamp,
   event_name as step1_event_name,
   user_pseudo_id as step1_user_pseudo_id,
   (select value.int_value from unnest(event_params) where key = 'session_id') as step1_session_id,
   (select value.string_value from unnest(event_params) where key = 'page_location') as step1_page_location,
   concat(user_pseudo_id, cast(event_timestamp as string)) as step1_unique_event_id,

   -- new fields for step 2
   step2_user_pseudo_id,
   step2_unique event_id

from `project.dataset.table.event_*`

-- step 2 join
left join (
   select
      event_timestamp as step2_event_timestamp,
      user_pseudo_id as step2_user_pseudo_id,
      (select value.int_value from unnest(event_params) where key =   'session_id') as step2_session_id,
      concat(user_pseudo_id, cast(event_timestamp as string)) as step2_unique_event_id
   from `project.dataset.table.event_*`
   where _table_suffix between '2025-04-01' and '2025-04-30'
   and event_name = 'view_search_results' -- step 2 filter
)
   on user_pseudo_id = step2_user_pseudo_id
   and (select value.int_value from unnest(event_params) where key = 'session_id') = step2_session_id
   and event_timestamp < step2_event_timestamp

where _table_suffix between '2025-04-01' and '2025-04-30'
and regexp_contains((select value.string_value from unnest(event_params) where key = 'page_location'), r'/homepage') -- step 1 filter
Let’s look at each new line we’ve added:
- left join (select…where event_name = ‘view_search_results’): This takes any data from the events tables (between April 1 and April 30) where the user made a search on the site. To make things clearer, we prefix everything in this select statement with step2_ so that we can differentiate the fields for each step. You can update the where statement to whatever you need for your funnel.
- on user_pseudo_id = step2_user_pseudo_id: For any left join, you must define how we join the data together. First, we want to make sure that the same user completes both steps.
- and (select value.int_value from unnest(event_params) where key = ‘session_id’) = step2_session_id: For this specific funnel, we also want all steps to happen in the same session. You may not need to use this in all your funnels.
- and event_timestamp < step2_event_timestamp: Most importantly, we need to make sure that step 1 occurred before step 2, i.e., the timestamp of step 1 is less than the timestamp of step 2.
- step2_user_pseudo_id / step2_unique_event_id: I’ve also added in the user ID and unique event ID for step 2, using the s2 alias so BigQuery knows where to get these fields.
3-Step Funnel: Join Step 3
As before, we simply need to join the third and final step.
Again, the key points are:
- Add any additional fields you want to output (using the step3_ prefix this time)
- Filter the data you are joining by what you need the next step to be, and the same date range as the previous step
- Make sure that your join conditions are set properly (same user, same session, and the event happened after the first event)
select
   parse_date('%Y%m%d', event_date) as date,
   event_timestamp as step1_event_timestamp,
   event_name as step1_event_name,
   user_pseudo_id as step1_user_pseudo_id,
   (select value.int_value from unnest(event_params) where key = 'session_id') as step1_session_id,
   (select value.string_value from unnest(event_params) where key = 'page_location') as step1_page_location,
   concat(user_pseudo_id, cast(event_timestamp as string)) as step1_unique_event_id,
   step2_user_pseudo_id,
   step2_unique_event_id,

   -- new fields for step 3
   step3_user_pseudo_id,
   step3_unique_event_id

from `project.dataset.table.event_*`

-- step 2 join
left join (
   select
      event_timestamp as step2_event_timestamp,
      event_name as step2_event_name,
      user_pseudo_id as step2_user_pseudo_id,
      (select value.int_value from unnest(event_params) where key =   'session_id') as step2_session_id,
      concat(user_pseudo_id, cast(event_timestamp as string)) as step2_unique_event_id
   from `project.dataset.table.event_*`
   where _table_suffix between '2025-04-01' and '2025-04-30'
   and event_name = 'view_search_results' -- step 2 filter
)
   on user_pseudo_id = step2_user_pseudo_id
   and (select value.int_value from unnest(event_params) where key = 'session_id') = step2_session_id
   and event_timestamp < step2_event_timestamp

-- step 3 join
left join (
   select
      event_timestamp as step3_event_timestamp,
      user_pseudo_id as step3_user_pseudo_id,
      (select value.int_value from unnest(event_params) where key =   'session_id') as step3_session_id,
      concat(user_pseudo_id, cast(event_timestamp as string)) as step3_unique_event_id
   from `project.dataset.table.event_*`
   where _table_suffix between '2025-04-01' and '2025-04-30'
   and event_name = 'add_item_to_cart' -- step 3 filter
)
   on step2_user_pseudo_id = step3_user_pseudo_id
   and step2_session_id = step3_session_id
   and step2_event_timestamp < step3_event_timestamp

where _table_suffix between '2025-04-01' and '2025-04-30'
and regexp_contains((select value.string_value from unnest(event_params) where key = 'page_location'), r'/homepage') -- step 1 filter
Once more, let’s break down the additional lines in the query:
- left join (select…where event_name = ‘add_item_to_cart’): This takes any data from prep where the user added an item to their cart. We again use an alias, but this time it’s s3.
- on step2_user_pseudo_id = step3_user_pseudo_id: Since we’ve made sure that we join step 1 and step 2 on the same user, we can now join the users from step 3 to the users of step 2.
- and step2_session_id = step3_session_id: Again, for this funnel, we need to make sure that we only include data where users have completed this journey in a single session.
- and step2_event_timestamp < step3_event_timestamp: Finally, we confirm that step 3 occurs after the user completes step 2.
- step3_user_pseudo_id / step3_unique_event_id: I’ve also added in the user ID and unique event ID for step 3, using the step3_ prefix.

3-Step Funnel: Remove unnecessary fields from the output
For the funnel, we only need the date, user and event counts, so we can remove some of the extra fields from step 1.
select
   parse_date('%Y%m%d', event_date) as date,
   user_pseudo_id as step1_user_pseudo_id,
   concat(user_pseudo_id, cast(event_timestamp as string)) as step1_unique_event_id,
   step2_user_pseudo_id,
   step2_unique_event_id,
   step3_user_pseudo_id,
   step3_unique_event_id

from `project.dataset.table.event_*`

-- step 2 join
left join (
   select
      event_timestamp as step2_event_timestamp,
      event_name as step2_event_name,
      user_pseudo_id as step2_user_pseudo_id,
      (select value.int_value from unnest(event_params) where key =   'session_id') as step2_session_id,
      concat(user_pseudo_id, cast(event_timestamp as string)) as step2_unique_event_id
   from `project.dataset.table.event_*`
   where _table_suffix between '2025-04-01' and '2025-04-30'
   and event_name = 'view_search_results' -- step 2 filter
)
   on user_pseudo_id = step2_user_pseudo_id
   and (select value.int_value from unnest(event_params) where key = 'session_id') = step2_session_id
   and event_timestamp < step2_event_timestamp

-- step 3 join
left join (
   select
      event_timestamp as step3_event_timestamp,
      user_pseudo_id as step3_user_pseudo_id,
      (select value.int_value from unnest(event_params) where key =   'session_id') as step3_session_id,
      concat(user_pseudo_id, cast(event_timestamp as string)) as step3_unique_event_id
   from `project.dataset.table.event_*`
   where _table_suffix between '2025-04-01' and '2025-04-30'
   and event_name = 'add_item_to_cart' -- step 3 filter
)
   on step2_user_pseudo_id = step3_user_pseudo_id
   and step2_session_id = step3_session_id
   and step2_event_timestamp < step3_event_timestamp

where _table_suffix between '2025-04-01' and '2025-04-30'
and regexp_contains((select value.string_value from unnest(event_params) where key = 'page_location'), r'/homepage') -- step 1 filter
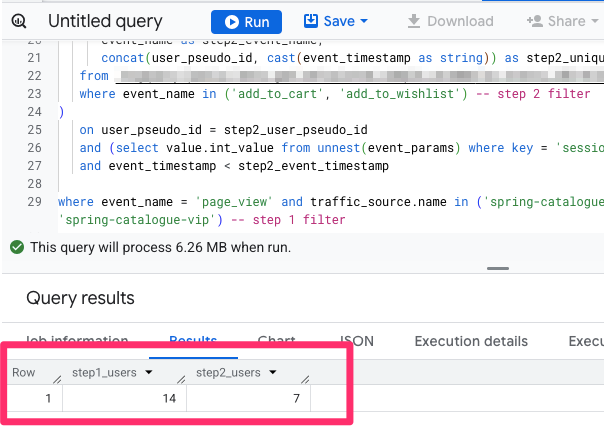
You can now run this query and review the data to see if it makes sense with what you expect.
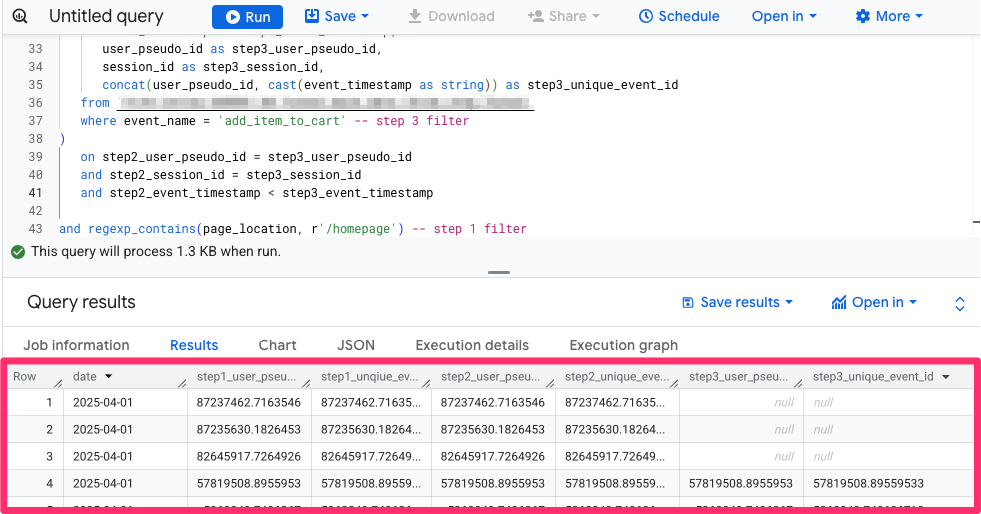
If you see null for any of the user_psuedo_id or unique_event_id columns, like in rows 1-3 above, this just means the user didn’t complete one or two of the subsequent steps but did complete the step(s) before!
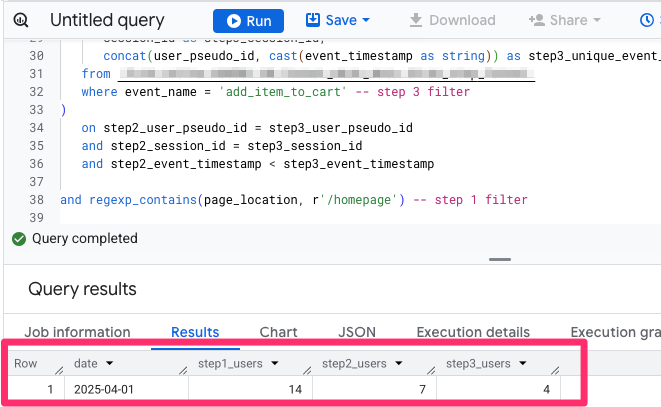
You can also change the top few lines of code between select and from to the ones below, so you just see the user counts for each step (you can also do this with the event counts). This is just to see what the numbers look like. We will change this back before we save this as a table.
date,
count(distinct user_pseudo_id) as step1_users,
count(distinct step2_user_pseudo_id) as step2_users,
count(distinct step3_user_pseudo_id) as step3_users
You’ll also need to add a group by statement at the very end of your query.
group by date
The BigQuery output will look like this (the values will be based on your data, of course):
In the next step, we will save this query to a table, so I will add all the fields I want back to the select statement (between select and from):
parse_date('%Y%m%d', event_date) as date,
user_pseudo_id as step1_user_pseudo_id,
concat(user_pseudo_id, cast(event_timestamp as string)) as step1_unique_event_id,
step2_user_pseudo_id,
step2_unique_event_id,
step3_user_pseudo_id,
step3_unique_event_id
3-Step Funnel: Save data to a table
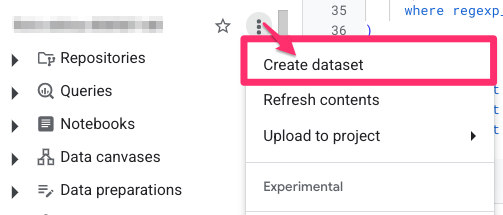
To save this table (so we can access it in Looker Studio), you will need to create a dataset if you don’t already have one.
You can do this by clicking the menu next to your BigQuery project and selecting “Create dataset”. You could name your dataset something like “funnels”, and then each table can be named based on the type of funnel.
Then, we add these three lines at the top so that we can save this data to a table and access it in Looker Studio:
- create or replace table `project.dataset.table`: This will create a new table under the defined path if one doesn’t already exist. If you’re re-running this query after making some changes, it will replace the existing table with one from the updated query.
- partition by date: Partitioning splits a large table into smaller segments based on a specified column, in this case, date. When you query data filtered by that column, BigQuery only scans the relevant partitions instead of the entire table, so it’s much more performant.
- as: This is necessary so that the above statements work.
create or replace table `project.dataset.table` # e.g. ga4data.funnels.add_to_cart_funnel
partition by date
as

select
parse_date('%Y%m%d', event_date) as date,
user_pseudo_id as step1_user_pseudo_id,
concat(user_pseudo_id, cast(event_timestamp as string)) as step1_unique_event_id,
step2_user_pseudo_id,
step2_unique_event_id,
step3_user_pseudo_id,
step3_unique_event_id

from `project.dataset.table.event_*`

-- step 2 join
left join (
select
event_timestamp as step2_event_timestamp,
event_name as step2_event_name,
user_pseudo_id as step2_user_pseudo_id,
(select value.int_value from unnest(event_params) where key = 'session_id') as step2_session_id,
concat(user_pseudo_id, cast(event_timestamp as string)) as step2_unique_event_id
from `project.dataset.table.event_*`
where _table_suffix between '2025-04-01' and '2025-04-30'
and event_name = 'view_search_results' -- step 2 filter
)
on user_pseudo_id = step2_user_pseudo_id
and (select value.int_value from unnest(event_params) where key = 'session_id') = step2_session_id
and event_timestamp < step2_event_timestamp

-- step 3 join
left join (
select
event_timestamp as step3_event_timestamp,
user_pseudo_id as step3_user_pseudo_id,
(select value.int_value from unnest(event_params) where key = 'session_id') as step3_session_id,
concat(user_pseudo_id, cast(event_timestamp as string)) as step3_unique_event_id
from `project.dataset.table.event_*`
where _table_suffix between '2025-04-01' and '2025-04-30'
and event_name = 'add_item_to_cart' -- step 3 filter
)
on step2_user_pseudo_id = step3_user_pseudo_id
and step2_session_id = step3_session_id
and step2_event_timestamp < step3_event_timestamp

where _table_suffix between '2025-04-01' and '2025-04-30'
and regexp_contains((select value.string_value from unnest(event_params) where key = 'page_location'), r'/homepage') -- step 1 filter
And, that’s it! You’ve officially recreated a three-step funnel in BigQuery where the user needs to complete each step of the funnel within the same session to be included.
Example 2: Two-step funnel with breakdowns
For this example, I want to look at a path where a user came from one of three spring catalogue emails and then proceeded to either add an item to their cart (add_to_cart) or add it to their wishlist (add_to_wishlist) within the same session and include a breakdown by UTM campaign for step 1 and event name for step 2.
The cool thing about creating this funnel in BigQuery is that I can expand the first step by UTM campaign and then the second step by event name, which you cannot do in the GA4 interface. This allows me to view the funnel as a whole, and then I can also see the funnel with different combinations of UTM parameters and event names, all within the same funnel.
2-Step Funnel: Adding in all the fields we need
Again, we start by compiling all the necessary elements into the query for step 1, adjusting it as needed based on the specific fields required, e.g., the UTM campaign is added for this funnel, given what we’re trying to achieve.
To build this, we will reference all the daily event tables in the GA4 export dataset and use a filter to pull through only the dates we are interested in.
select
   parse_date('%Y%m%d', event_date) as date,
   event_timestamp,
   event_name,
   user_pseudo_id,
   (select value.int_value from unnest(event_params) where key = 'session_id'),
   (select value.string_value from unnest(event_params) where key = 'page_location'),
   concat(user_pseudo_id, cast(event_timestamp as string)),
from `project.dataset.table.event_*`
where _table_suffix between '2025-04-01' and '2025-04-30'
If you want a breakdown of which fields are necessary for every funnel, check out the previous Step 1 chapter. For this query, the additional fields I’ve added are just the utm_campaign.
2-Step Funnel: Step 1
This is where we will alias the fields since BigQuery will complain about the fields being “ambiguous” if you don’t update the names of each field based on the step (since we’ll have multiple of the same fields per step).
select
   parse_date('%Y%m%d', event_date) as date,
   event_timestamp as step1_event_timestamp,
   event_name as step1_event_name,
   user_pseudo_id as step1_user_pseudo_id,
   (select value.int_value from unnest(event_params) where key = 'session_id') as step1_session_id,
   traffic_source.name as step1_utm_campaign,
   concat(user_pseudo_id, cast(event_timestamp as string)) as step1_unique_event_id,
from `project.dataset.table.event_*`
where _table_suffix between '2025-04-01' and '2025-04-30'
and event_name = 'page_view' and traffic_source.name in ('spring-catalogue-launch', 'spring-catalogue-reminder', 'spring-catalogue-vip')
We haven’t updated things much, but the two changes we did make:
- Updated each field to start with step1_ so it’s unique.
- Updated the filter, so the data is specific to what we want for step 1: p.event_name = ‘page_view’ and traffic_source.name in (‘spring-catalogue-launch’, ‘spring-catalogue-reminder’, ‘spring-catalogue-vip’)

2-Step Funnel: Join Step 2 to Step 1
The general idea is to start with all the data for step 1 and then join the data from step 2. In the end, we will output:
- the date,
- user IDs and unique event IDs for both steps,
- the UTM campaigns for step 1, and
- the event names for step 2.
This is very similar to what we did in the previous three-step funnel, with just the addition of a couple dimensions.
With each step, you want to keep this checklist in mind:
- Add any additional fields you want to output
- Filter the data you are joining by what you need the next step to be
- Confirm that your join conditions are set properly (same user, same session, and the event happened after the first event)
select
   parse_date('%Y%m%d', event_date) as date,
   event_timestamp as step1_event_timestamp,
   event_name as step1_event_name,
   user_pseudo_id as step1_user_pseudo_id,
   (select value.int_value from unnest(event_params) where key = 'session_id') as step1_session_id,
   traffic_source.name as step1_utm_campaign,
   concat(user_pseudo_id, cast(event_timestamp as string)) as step1_unique_event_id,

   -- new fields for step 2
   step2_user_pseudo_id,
   step2_unique_event_id,
   step2_event_name

from `project.dataset.table.event_*`

-- step 2 join
left join (
   select
      event_timestamp as step2_event_timestamp,
      user_pseudo_id as step2_user_pseudo_id,
      (select value.int_value from unnest(event_params) where key =   'session_id') as step2_session_id,
      event_name as step2_event_name,
      concat(user_pseudo_id, cast(event_timestamp as string)) as step2_unique_event_id
   from `project.dataset.table.event_*`
   where _table_suffix between '2025-04-01' and '2025-04-30'
   and event_name in ('add_to_cart', 'add_to_wishlist') -- step 2 filter
)
   on user_pseudo_id = step2_user_pseudo_id
   and (select value.int_value from unnest(event_params) where key = 'session_id') = step2_session_id
   and event_timestamp < step2_event_timestamp

where _table_suffix between '2025-04-01' and '2025-04-30'
and event_name = 'page_view' and traffic_source.name in ('spring-catalogue-launch', 'spring-catalogue-reminder', 'spring-catalogue-vip') -- step 1 filter
Again, you can review the previous Join Step 1 to Step 2 chapter to see a breakdown of each line we’ve added to the query, where you will start to see a pattern. For each step:
- Set up an alias for the data (the first step always comes directly from the events table)
- Filter the data in the join by what the user needed to do to be included in that step
- Add the fields for each metric we want to include (users and event count)
When you’re adding a dimension to break down a step further, you will need to make sure that that dimension is included in the output. In this case, I’ve added step2_event_name since I want the option to view the funnel for each event in step 2.
2-Step Funnel: Remove unnecessary fields from the output
When creating a funnel with a breakdown, you need to include the fields you want to segment by in the output. In this case, that’s the UTM campaign for step 1 and the event name for step 2. All other fields can be removed, except for the date, user IDs, and event IDs.
select
   parse_date('%Y%m%d', event_date) as date,
   user_pseudo_id as step1_user_pseudo_id,
   concat(user_pseudo_id, cast(event_timestamp as string)) as step1_unique_event_id,
   traffic_source.name as step1_utm_campaign,
   step2_user_pseudo_id,
   step2_unique_event_id,
   step2_event_name

from `project.dataset.table.event_*`

-- step 2 join
left join (
   select
      event_timestamp as step2_event_timestamp,
      user_pseudo_id as step2_user_pseudo_id,
      (select value.int_value from unnest(event_params) where key =   'session_id') as step2_session_id,
      event_name as step2_event_name,
      concat(user_pseudo_id, cast(event_timestamp as string)) as step2_unique_event_id
   from `project.dataset.table.event_*`
   where _table_suffix between '2025-04-01' and '2025-04-30'
   and event_name in ('add_to_cart', 'add_to_wishlist') -- step 2 filter
)
   on user_pseudo_id = step2_user_pseudo_id
   and (select value.int_value from unnest(event_params) where key = 'session_id') = step2_session_id
   and event_timestamp < step2_event_timestamp

where _table_suffix between '2025-04-01' and '2025-04-30'
and event_name = 'page_view' and traffic_source.name in ('spring-catalogue-launch', 'spring-catalogue-reminder', 'spring-catalogue-vip') -- step 1 filter
In the previous Join Step 2 and Step 1 and Join Step 3 chapters, I explained how to join each new step to the previous one. This query is no different than before when it comes to how to join each step, so that you can review those chapters for more details!
The last two things you need to do are: (1) test the funnel and (2) once you’re confident in your funnel, save it to a table (this is covered in more detail in the Save data to a table chapter).
You can replace the select statement with the one below to display only the user counts for each step (you can also do this with the event counts).
select
   count(distinct step1_user_pseudo_id) as step1_users,
   count(distinct step2_user_pseudo_id) as step2_users
This will leave you with just two columns in your output.
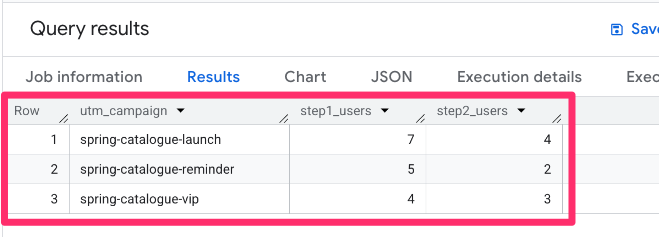
Now, add in a dimension, too:
select
   traffic_source.name as step1_utm_campaign,
   count(distinct step1_user_pseudo_id) as step1_users,
   count(distinct step2_user_pseudo_id) as step2_users
You’ll also need to add a group by statement at the very end of your query.
group by traffic_source.name
This will show us the number of users who landed on your site through a campaign and then completed one of the two events, split by the UTM campaign.
Feel free to play around and try different combinations of fields to see what the output looks like. Once you’ve tested the query and feel good about it, save it to a table.
create or replace table `project.dataset.table` # e.g. `ga4data.funnels.utm_campaign_funnel`
partition by date
as

select
   parse_date('%Y%m%d', event_date) as date,
   user_pseudo_id as step1_user_pseudo_id,
   concat(user_pseudo_id, cast(event_timestamp as string)) as step1_unique_event_id,
   traffic_source.name as step1_utm_campaign,
   step2_user_pseudo_id,
   step2_unique_event_id,
   step2_event_name

from `project.dataset.table.event_*`

-- step 2 join
left join (
   select
      event_timestamp as step2_event_timestamp,
      user_pseudo_id as step2_user_pseudo_id,
      (select value.int_value from unnest(event_params) where key =   'session_id') as step2_session_id,
      event_name as step2_event_name,
      concat(user_pseudo_id, cast(event_timestamp as string)) as step2_unique_event_id
   from `project.dataset.table.event_*`
   where _table_suffix between '2025-04-01' and '2025-04-30'
   and event_name in ('add_to_cart', 'add_to_wishlist') -- step 2 filter
)
   on user_pseudo_id = step2_user_pseudo_id
   and (select value.int_value from unnest(event_params) where key = 'session_id') = step2_session_id
   and event_timestamp < step2_event_timestamp

where _table_suffix between '2025-04-01' and '2025-04-30'
and event_name = 'page_view' and traffic_source.name in ('spring-catalogue-launch', 'spring-catalogue-reminder', 'spring-catalogue-vip') -- step 1 filter
Now, we’ve been able to go one step further and add a breakdown to our funnel–two breakdowns, in fact!

Visualize BigQuery funnel with Looker Studio
I hope that seeing how you can create a very customized funnel in BigQuery has inspired you to try it out for yourself! If you’re thinking, “Ok, this is helpful, but I want to put this into a report,” that is exactly what we’re going to do now.
To do this, we will use Looker Studio, which is Google’s free tool for creating customized dashboards and reports! You can connect your BigQuery tables (and many other data sources) to Looker Studio and create a ton of different charts. I’ve written an article on Looker Studio, so you can check that out if you’re new to it.
Connecting BigQuery data to Looker Studio
Before we begin, you will need to have saved your data to a table in BiQuery, so if you skipped that step, go back and do that first.
Once you’re in Looker Studio (follow this link), click to create a new report.
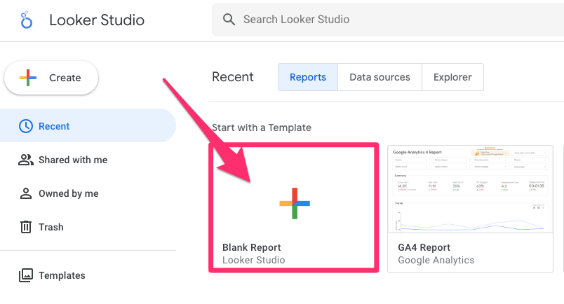
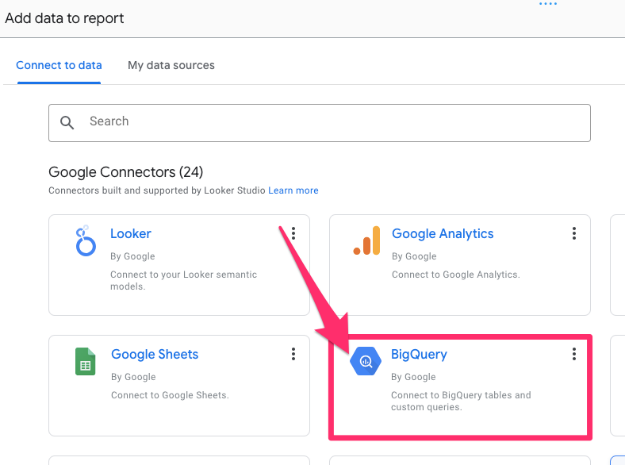
When you’re blank report loads, you will be prompted to add a data source. Click the “BigQuery” tile.
Under “My Projects”, find the BQ project, dataset, and then the table(s) that you created above. Check the box next to “Use date as date range dimension” and click “Add”.
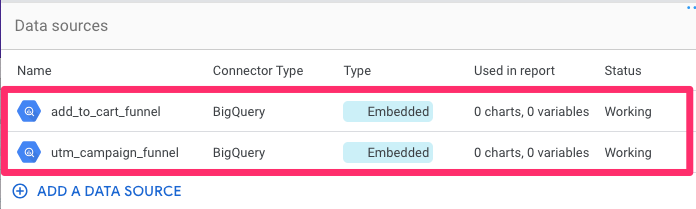
I will add both tables that I created, so if you need to add any more, go to Resource (in the top navigation) > Manage added data sources > Add a data source > BigQuery and follow the same steps as before.
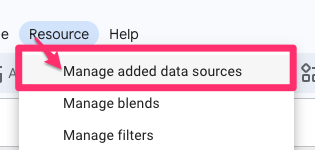
To review the data added to your report, you can go to Resource > Manage added data sources.
Example 1: Basic three-step funnel with no breakdowns
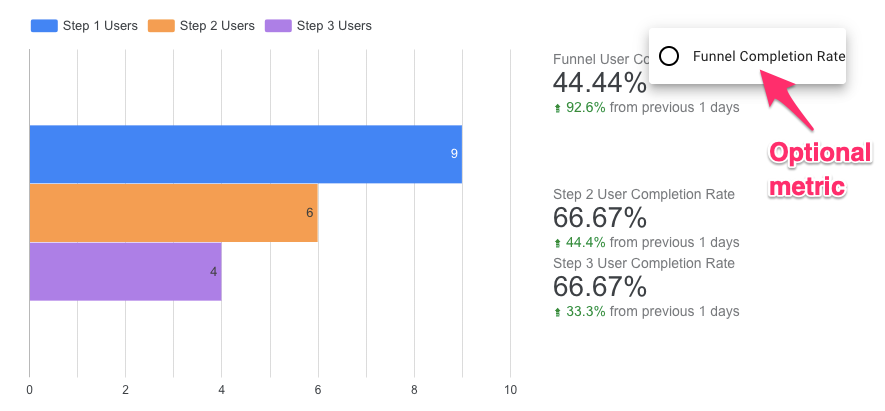
We’ll start by creating a simple bar chart to visualize the funnel and include some scorecards to show us the completion and abandonment rates.
Add a bar chart to visualize the funnel
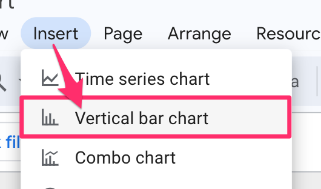
To create the bar chart, go to Insert (in the top navigation) > Vertical Bar Chart.
Now, in the Setup tab on the right, we will need to configure a few things:
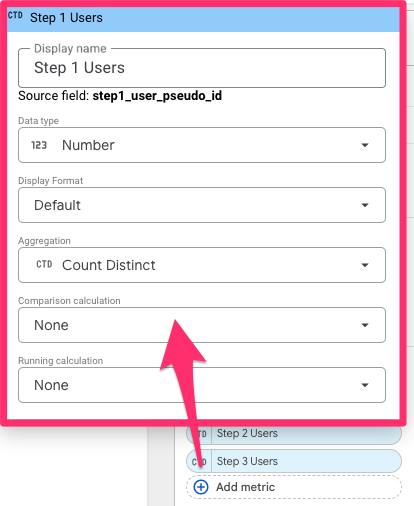
- Metric: Select the three user counts (in order from step 1 to step 3). Click to the left of the metric to open the customization pop-up. Here, you can rename the metric to something more user-friendly and make sure that you’ve set the aggregation to Count distinct.

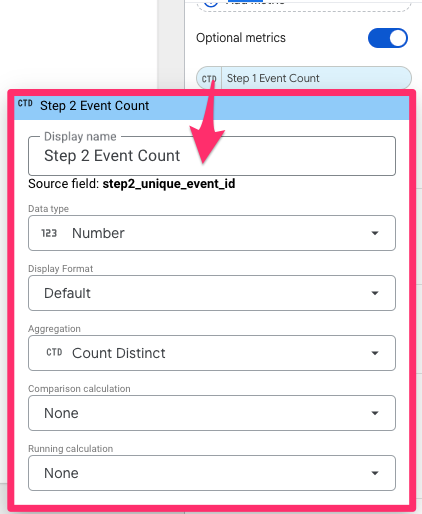
- Optional metrics: Toggle on Optional Metrics. Select the three event counts.. Same as above, update the metric name and make sure that you’ve set the aggregation to Count distinct

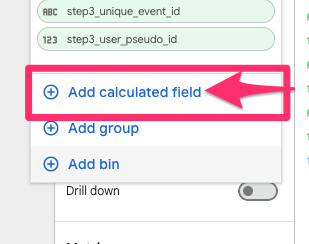
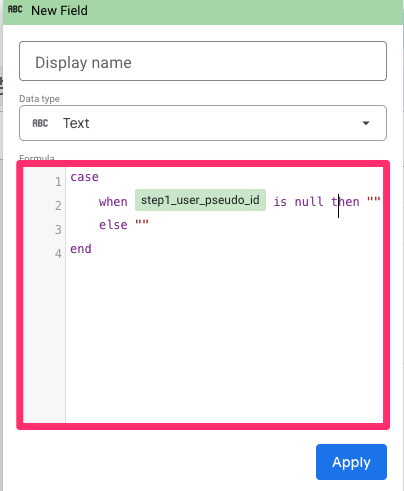
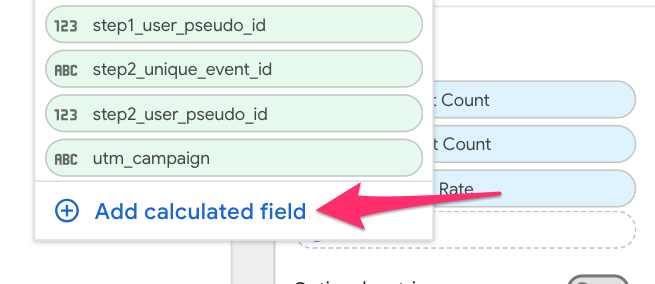
- Dimension: The chart needs a dimension for the visualization to work, and it defaults to one of the dimensions in the table. Therefore, we will need to create a custom field to either label the steps or leave it blank. Click the default dimension and select “Add calculated field” at the bottom of the list.

I’ll usually do something like what I have in the screenshot, so then it’s just always blank for the left-side label.

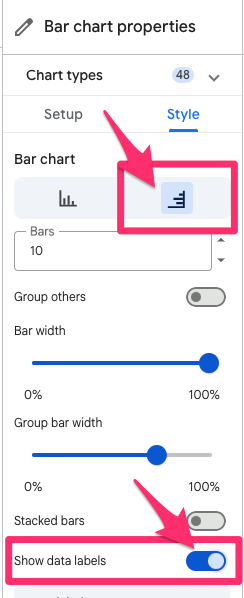
Lastly, for the chart, go to the Style tab. Under the Bar chart section:
- Select “Horizontal” to update the direction of the bars.
- To make things easier to read, toggle on “Show data labels”.
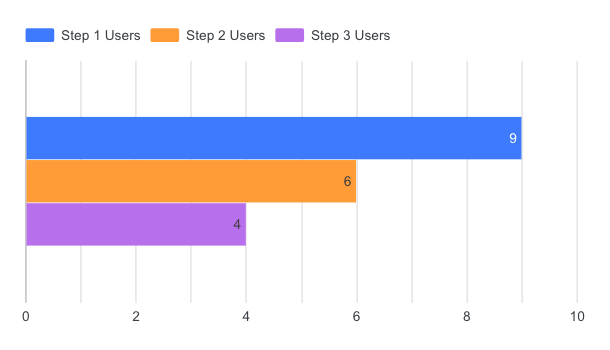
Now, you should have a chart that looks something like this! Pretty cool, right?
Add completion and abandonment rates
To level up your report just a little bit, let’s add in the completion and abandonment rates. Adding these allows you to get a quick overview of what percentage of users complete the funnel.
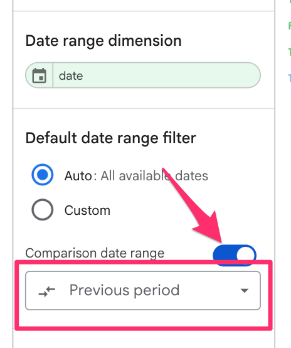
You can track any changes in the completion rate from the previous period, which can indicate if there is a problem with the flow, e.g., a significant drop in completion rate compared to the previous period.
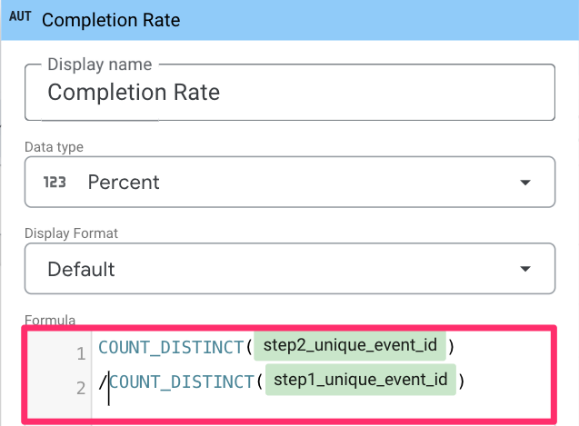
Completion Rate
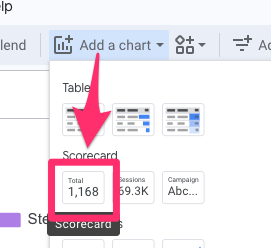
Go to Add a chart > Scorecard.
Now, in the Setup tab on the right, we will need to configure a few things:
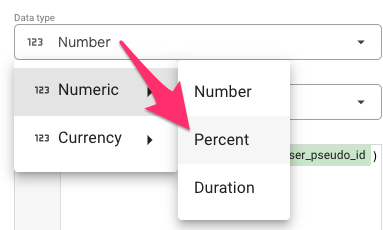
- Metric: Select “Add calculated field” at the bottom. Enter the following formula: COUNT_DISTINCT(step{X}_user_pseudo_id) / COUNT_DISTINCT(step{X-1}_user_pseudo_id)
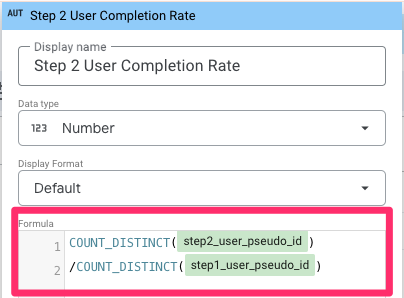

Change the Data type to “Percent”.


- Optional metrics: You can also include the click-through rate for each step. Select “Add calculated field” and use the formula: COUNT_DISTINCT(step{X}_unique_event_id) / COUNT_DISTINCT(step{X-1}_unique_event_id)
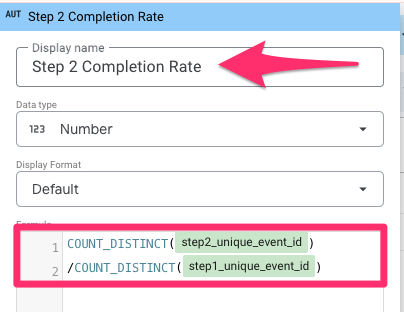

Change the Data type to “Percent”.

- Enable the Comparison date range to see how these rates change over time and choose what comparison you want. For this example, I am using the previous period.

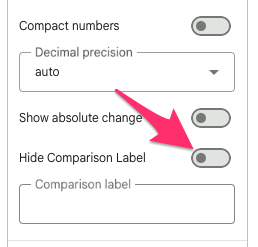
In the Style tab, toggle off the Hide comparison label. Here, you can also make any changes to the appearance of the scorecards!
And now, this is what I have in my report!
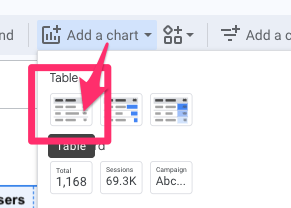
Example 2: Two-step funnel with breakdown
For this visualization, we will create a table that contains the same type of information as the above visualization, but broken down by UTM campaign.
If you want to include both the UTM campaign and event name in the table, things don’t look exactly as you think they will. While it’s very much possible to get a useful visualization from this data, it requires the use of custom queries, which is beyond this tutorial, so maybe it’s a topic for another day!
Add a table to visualize the funnel
To create the table, go to Add a chart > Table.
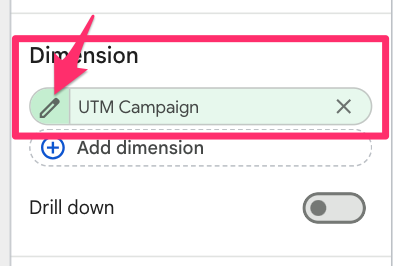
In the Setup tab, let’s add some data:
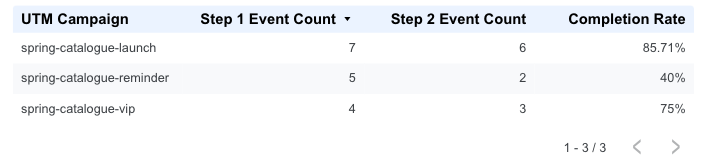
- Dimensions: To view the funnel split by the campaign, select “utm_campaign” as the field. You can update the name of the dimension to be more user-friendly by selecting the pencil icon next to it.

- Metrics: We’ll start by adding in our two unique event IDs and renaming them to “Step X Event Count”. Make sure that you see “CTD” next to the metric (showing the aggregation method), which stands for “count distinct”.
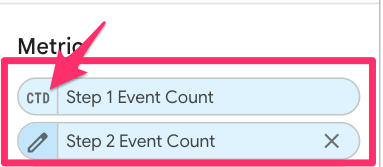

Additionally, we will create our own metric by selecting “Add a calculated field”.

This calculated field will be the completion rate! The formula is: COUNT_DISTINCT(step2_unique_event_id)/count_distinct(step1_unique_event_id). Be sure to update the Data type to “Percent”.

Now, you have a simple yet effective table that illustrates how each campaign performed in terms of influencing users to add an item to their cart or wishlist.
How to Build a GA4 Funnel with BigQuery and Looker Studio: Final Words
While we got to dive pretty deep into creating funnels in BigQuery, there is still much more that you can explore!
This article is only the start, and there are many ways you can go in and customize these funnels in BigQuery to fit exactly what you need. There are also plenty of ways to visualize this data in Looker Studio. Now, it’s time for you to take what you’ve learned, experiment with your own data, and start building some cool funnels!
3 COMMENTS
Hi Julius,
This is very helpful thanks for your content. Maybe i didn't understand, but create table will be for a fix date (here between 2025-04-01' and '2025-04-30'). Is there a way to increment the data to the new table. Say i want to start on 2025-04-01 and add the data forever into the table without having to manually change the date every day and run the query to create a new table.
My clients often want to visualize this data daily or weekly.
Thanks!
You could use Cloud Run functions or schedule your query to update at a specified time. Google has resources on both of these options:
Cloud run function: https://cloud.google.com/functions?hl=en
Scheduled query: https://cloud.google.com/bigquery/docs/scheduling-queries
Depending on the amount of data you're querying, Cloud Run functions might be a more cost-effective option.
Rafael,
BigQuery can accomplish exactly what you're looking for with scheduled queries.
But first, you have to make an adjustment to the query so that it no longer uses fixed dates. The following example uses a dynamic date range to select the last 7 days of data. (Note: it usually takes a few days for GA4 data to settle completely. The following is for illustrative purposes only)
WHERE
_TABLE_SUFFIX BETWEEN FORMAT_DATE('%Y%m%d', DATE_SUB(CURRENT_DATE(), INTERVAL 7 DAY))
AND FORMAT_DATE('%Y%m%d', DATE_SUB(CURRENT_DATE(), INTERVAL 1 DAY))
Consult documentation for more info because there are many ways to customize it:
https://docs.cloud.google.com/bigquery/docs/reference/standard-sql/date_functions
Once you have a flexible date range, you can schedule the query to run whenever you want. You can have the destination table cleared before it runs so you don't have to TRUNCATE it first. You can also have the data appended to an existing table. Again, there are a ton of options:
https://docs.cloud.google.com/bigquery/docs/scheduling-queries#before_you_begin
Cost: Speaking for myself, I have found that as long as my queries are responsible and use the amounts of data commonly seen in a weekly, monthly or yearly table, costs are minimal. I define a responsible query as one where you are actively using all the data returned.