
December 9, 2025
How to use Funnel Exploration Report in Google Analytics 4 (GA4)
Updated: December 9th, 2025
The only good funnel reports in older Google Analytics versions were related to Enhanced Ecommerce (I am talking about the Shopping and Checkout behavior). The others were mediocre at best.
With the rise of GA4, Google attempted to fix this issue by providing a Funnel Exploration report. It allows you to build funnel reports on the fly (as long as you have been collecting events for a while).
Want to see how many visitors go from viewing a product to the purchase? Done. Want to include/remove a certain step in the funnel? No problem.
In this blog post, I will show you how to use the Funnel Exploration report in Google Analytics 4. You will learn the following:
- The main parts of the interface and how they work
- How the funnel data is calculated in open/closed funnels
- How to build a basic Product view > Add To Cart > Purchase funnel
- Some additional tips
Ready? Let’s roll.
Table of Contents
– Here’s what you will learn in this article –
- Main components
- Example of Funnel Analysis Report
- Open vs. Closed funnels + how data is calculated
- Additional things/reminders
- Final Words
What is the Funnel Exploration Report in GA4?
The Funnel Exploration report is a tool in the “Explore” section of GA4 that lets you visualize the steps users take to complete a key event (like a purchase or a form submission).
You can use this report to:
- See where users “drop off” in the process.
- Compare how different segments of users (e.g., “Mobile” vs. “Desktop”) behave in the funnel.
- Analyze how much time passes between steps.
- Discover what users do instead of moving to the next step.
Other Exploration reports in Google Analytics 4
I have also published several other related blog posts that you might find useful:
Video tutorial
If you prefer video content, watch this video. However, this blog post contains some additional tips.
The interface of Google Analytics 4 has slightly changed since I recorded this video, but the main concepts are still valid.
#1. Understanding the Funnel Report interface
To get started, log in to your Google Analytics 4 property and click Explore (on the left sidebar). Then select Funnel Exploration (or Blank). If you choose Funnel Exploration, you will see a sample report with some configuration. And with Blank, well, you’ll get a blank piece of paper to start from scratch, and you will have to create a new tab with Funnel Exploration type.
The interface of the Explorations is split into 3 main parts/columns:
- Variables
- Tab settings
- The output (the Funnel Exploration report that you is generated based on your configuration)

Let’s take a closer look at each part.
#1.1. The variables column
This has nothing to do with Google Tag Manager’s variables. The Variables section in the GA4 Exploration reports is the place where you select data that you plan to use in a report:
- Date range
- Segments
- Dimensions
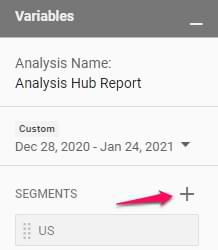
Also, you can change the name of the exploration in the top-left corner of the interface.

To select a different date range, click the date in the top-left corner (below the exploration name) and select whatever you need (like “last 7 days”, “Last 30 days”, etc.).

Note: Before we explore the interface, you must know that the Funnel Exploration report is based on Users. You cannot add other metrics like Event count or Sessions to the main funnel steps. The report’s goal is to show you how many users made it from one step to the next.

#1.1.1. Segments
If you want to compare how different groups of your users/visitors behave, you should include those segments in the Segments section first. I will show you how to add them to the actual report later.
You can choose from several segments that are already included, or you can add your own. You can do that by clicking the plus icon:
Then you can either create a custom segment or select a suggested one.

Speaking of custom segments, there are 3 types:
- User segment where you can include data of all users that match certain user criteria. Example: show all events of users who are from the US. This is equivalent to user segments in Universal Analytics.
- Session segment where you can include data of sessions that match certain criteria. Example: show all events of sessions where visitors downloaded an ebook. This is equivalent to session segments in Universal Analytics.
- Event segment where you include ONLY events based on certain criteria. This was not available in Universal Analytics. Example: Show data of all events that are lead_generated.
#1.1.2. Dimensions
Dimensions in Google Analytics are parameters/attributes of an event, product, transaction, user, etc. They are attributes that describe something. For example:
- Event name
- Transaction ID
- User’s pricing plan
- Product category, etc.
Here’s the catch in Explorations. If you want to use a dimension in Funnel Explorations within that report, you must include the dimension in the Variables column first. You can do that by clicking the Plus icon and then selecting what you need.
After you select the needed metric/dimension, click Apply button in the top-right corner.

To sum up, the Variables column is responsible for the data input. If you want to use some segments/dimensions, they must be included in that column. If you are missing something later down the line, you can add new items on the fly. Also, you can change the date range (which, obviously, also affects the scope of data input).
#1.2. The tab settings column
In this column, you can configure what the report will look like. First, there is a Technique drop-down menu (where you can select from things like Free Form, Funnel Exploration, etc.). In this blog post, I focus only on the Funnel Exploration part.
Let me take you through different options in the Tab Settings.
#1.2.1. Visualization
There are two options here:
- Standard Funnel
- Trended funnel
Standard Funnel is the one that you are probably most used to. It is a bar chart that shows how many people completed each step and what the drop-off is.

But it isn’t easy to understand how the funnel is performing over time. That’s why the second option (Trended Funnel) becomes very handy.
Each funnel step gets its line in the line chart, and you can see how they changed over time. If you click on a certain line in the chart, it will stay highlighted. Also, if you want to see only one particular line, then there are tabs above the chart that you can click. There’s one tab for each funnel step.

#1.2.2. Make open funnel
By default, Funnels in Google Analytics 4 are closed. This means that if a visitor enters the funnel at the 2nd (or further) step, he/she will not be counted in the funnel.
But if it’s ok for you if a visitor/user enters the funnel *at any step*, then you can click the Make open funnel toggle to allow that. I explain more about how this works in this chapter.

#1.2.3. Segment comparisons
In the Segment comparisons section, you can include up to 4 segments that are already included in the Segments section of the Variables tab.
You can add segments to the Tab Settings column by dragging them from the Variables tab. Also, you can double-click in the Variables tab, and they will be added automatically.
Let’s say that I want to compare how the US (users from the United States) segment is performing against the Non-US segment. The US segment is available in the exploration by default, but we will have to configure the Non-US segment ourselves.
First, double-click the US segment, and it will be automatically added to the comparison section.
In the Segments section of the Variables tab, click the Plus icon.
![]()
![]()
Then enter the following conditions:
- Custom segment: User segment
- Country ID does not exactly match US
- Then name the segment. Click SAVE AND APPLY.
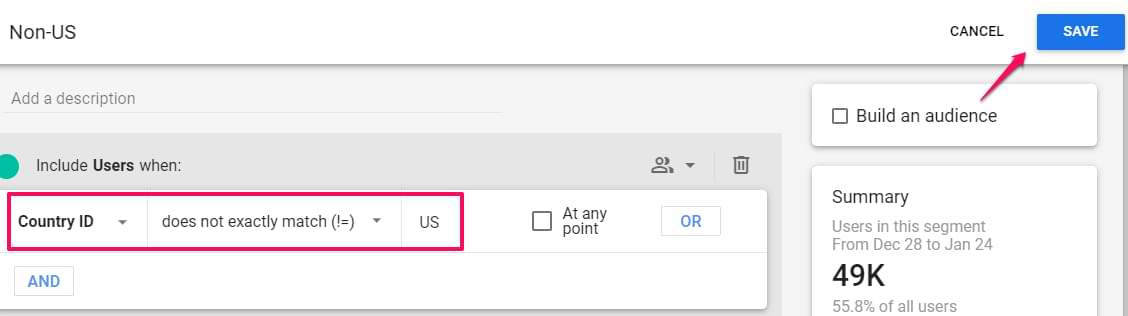
This new segment will be automatically added to the Segment comparisons section. We are now going a bit ahead of ourselves (because we haven’t configured our funnel yet), but here is what the segment comparison will look like.
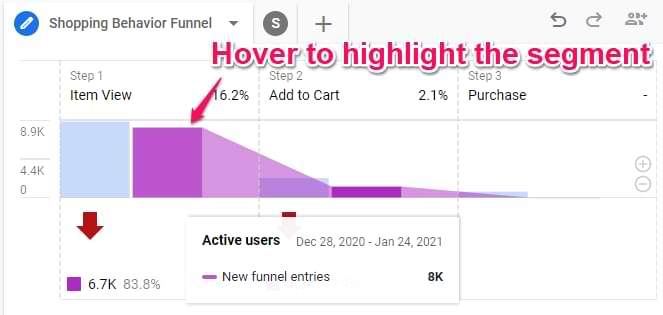
Each segment will get its bar (or line) in the funnel chart. Also, the breakdown table below the chart will show nested values.

Here, it’s more convenient to use the standard funnel report for segment comparison (because you can hover over a bar in the chart of a particular segment, and that entire segment will be highlighted).
As for trended funnels, each step gets an individual line in the chart. Compare 2 segments, and the number of lines doubles. If you have four funnel steps and compare three segments, that will be 12 lines in a single chart, which can make things noisy and difficult to digest.
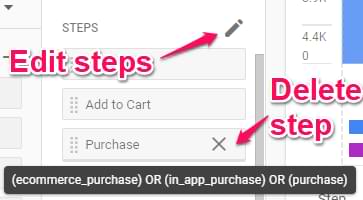
#1.2.4. Steps
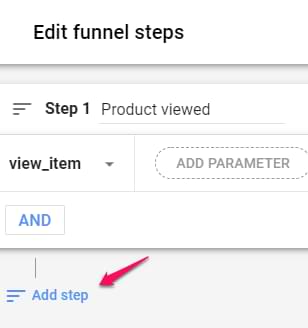
We have reached the main part of the funnel exploration report in Google Analytics 4, funnel steps. If you already have some predefined steps, you can delete them one-by-one by clicking the X next to each step. If you want to add/edit steps, click the Pencil icon.
This will open a funnel editing interface.
In each step, you can enter the label/name of it. It does not affect the data. Then, you can configure step conditions.
Click Add new condition and select from the dimensions that are by default available or are registered as custom definitions in your property. It’s convenient to use the search feature.
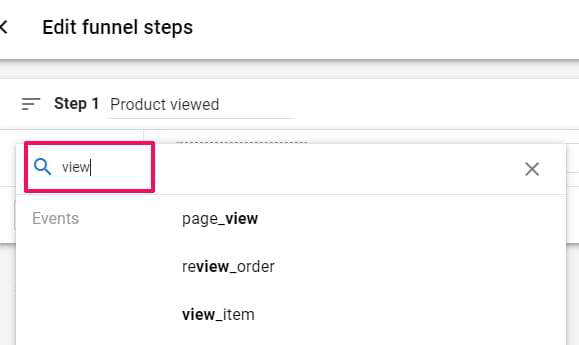
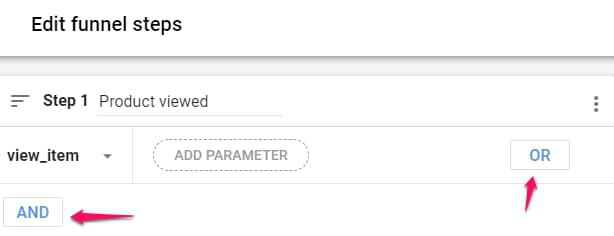
Once you correctly enter the condition, you can include additional ones (connected with AND and OR) in the same step.
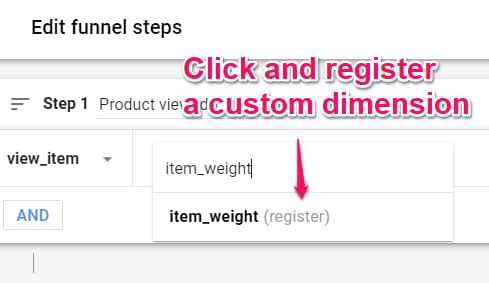
Also, if you try to use some parameter that is not registered as a custom dimension, you will see the (register) label next to it. Click that parameter, and you will be prompted to create it on the go.
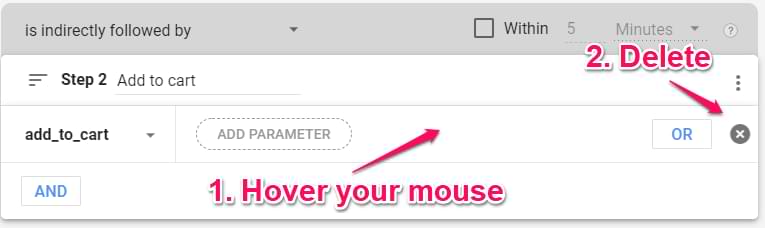
If you want to delete a particular condition, hover your mouse on the right side of that condition to see the Delete icon.
Each step also has several additional options in the top-right corner:
- Copy step
- Remove step
- Add step above
- Add step below
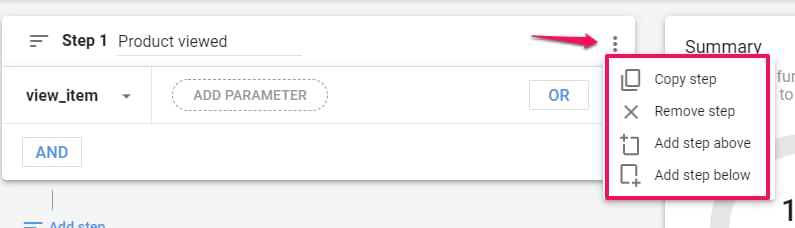
To add another funnel step, click Add step below.
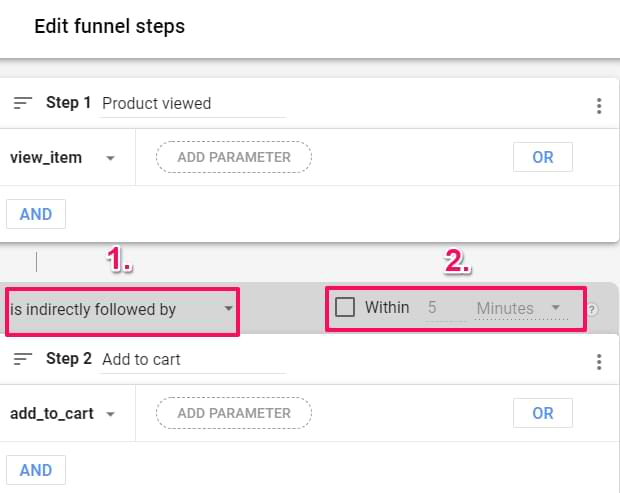
Here, you will see most of the settings that were also visible in the first step. However, some new things might tickle your curiosity.
- You can select whether you want this step to directly/indirectly follow the previous step. In most cases, I select indirectly.
- You can select the maximum time difference between the two steps. It can be as short as several seconds, but it can also take days.
When would you use this?
- Imagine you have a “session-based” goal, like view_item -> add_to_cart. You probably want this to happen in the same session. You could set the time constraint to “Within 30 minutes” or a couple of hours.
- If you are tracking a longer-term journey, like first_visit -> purchase, you might set the constraint to “Within 7 days” or leave it unchecked to allow any amount of time.
Once you have configured funnel steps, click Apply in the top-right corner.
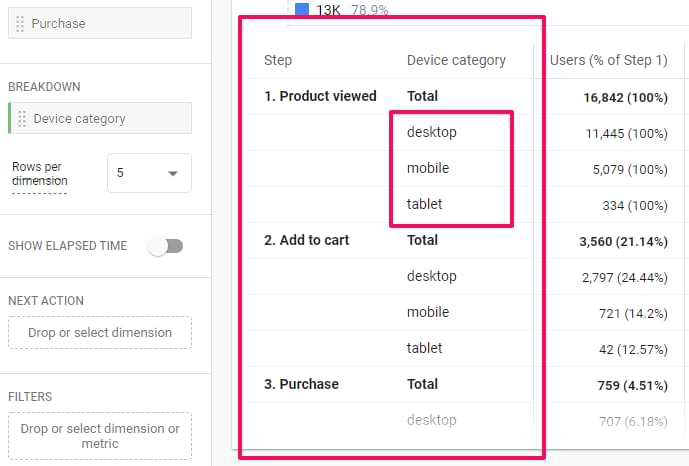
#1.2.5. Breakdown
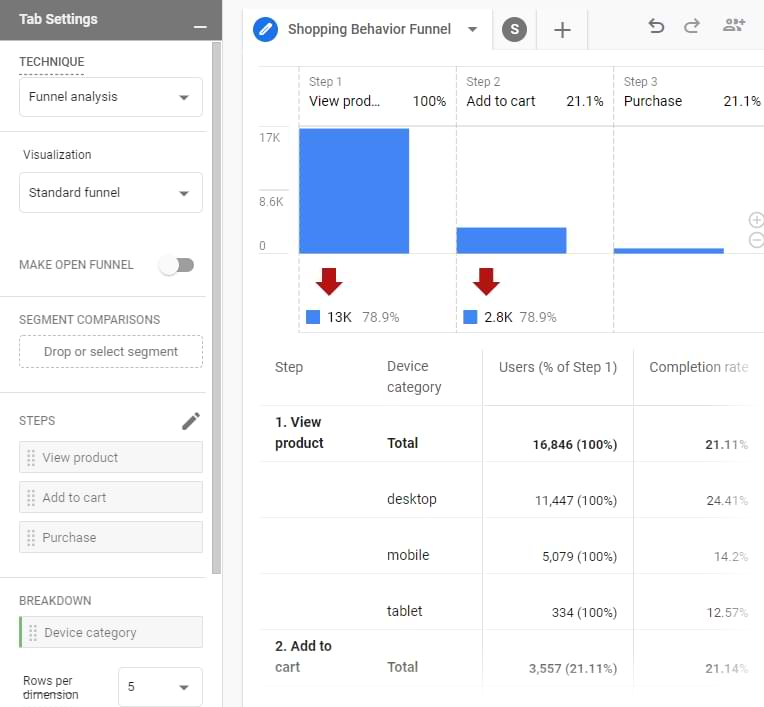
Below the funnel chart, you can see the data breakdown by a single dimension. For example, if you want to see how the funnel is completed with different devices, just add the Device Category.
If the dimension has more than several possible values, you can select how many rows per dimension do you want to display (the default is 5).
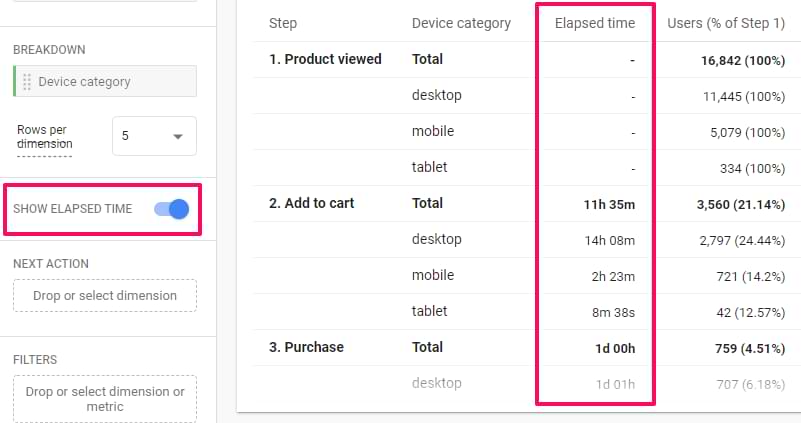
#1.2.6. Show elapsed time
If you want to see how much time (on average) your users/visitors need to advance from one step to another, enable the Show Elapsed Time.
#1.2.7. Next action
Want to see other events that a visitor does after a particular step? Drag the Event name dimension to the Next action section. Then, you can hover your mouse over any bar in the chart, and you will see a popup that shows the next 5 most popular events that a visitor did immediately after this step.
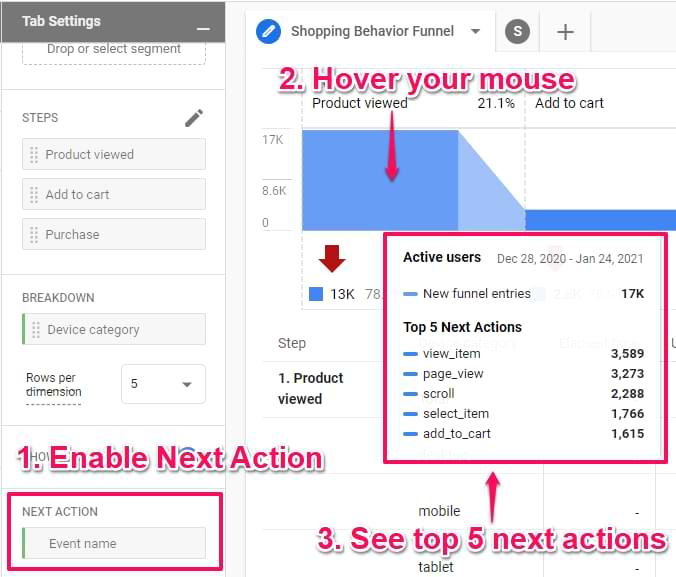
Note: The Next action filter accepts only one of two dimensions: event name and screen name.
Here’s a thing that I’ve noticed (but I don’t know if this will always be like that). In the screenshot above, you see 5 top events. One of them is a scroll (which is pretty obvious and does not provide a lot of value here. How about we exclude it from the report? I tried using Filters in the report (to exclude Event Name “scroll”), but that did not work.
However, here’s a workaround that worked well – create an event segment where you exclude all unwanted events. These events will not be displayed in the Top 5 Next Actions section.
Here are the settings of that segment:
- Custom Segment -> Event Segment
- Then delete the first empty condition (that says “Include…”)
- Click “Add group to exclude”
- And enter the names of the event that you wish to exclude.
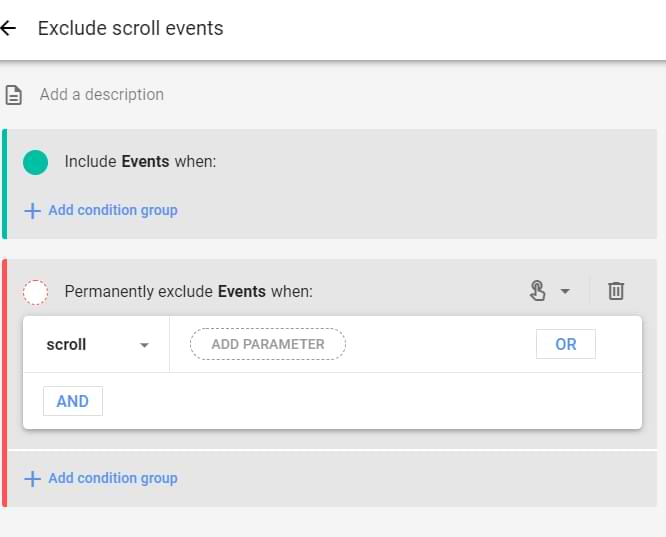
Add this segment to the report, and your “Top 5 Next Actions” might become a bit more valuable.
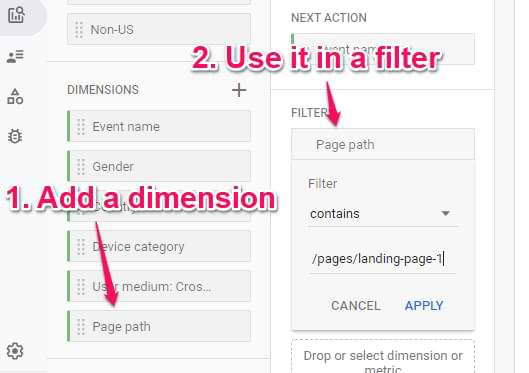
#1.2.8. Filters
If you want to narrow down the data that is used in the funnel exploration report, you can use filters. Here is an example:
- You have a bunch of landing pages with opt-in forms
- When a visitor submits the form, a generate_lead event is sent to GA4
Now, you only want to see the funnel on a particular landing page. That way, you could use a Page Path dimension in the Filters section, for example, Page Path contains /pages/landing-page-1.
Just ensure this dimension is included in the Dimensions section of the Variables column first.
#1.3. The Report
When the report is generated, you can interact with it and dig deeper.
If the difference between some steps is too large (for example, step 1 contains 5000 users and step 2 contains 150), you can zoom in. Click the Plus icon in the corner of the bar chart. Also, you can hover your mouse over the chart and scroll up/down to adjust.
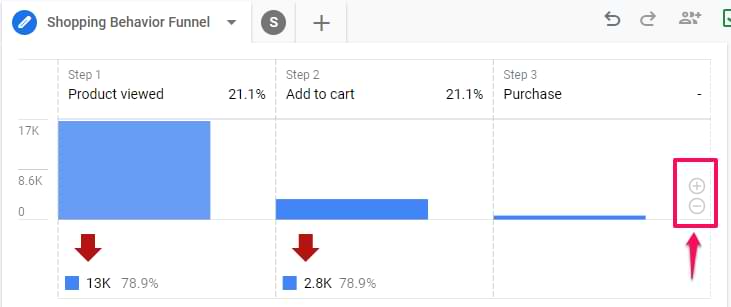
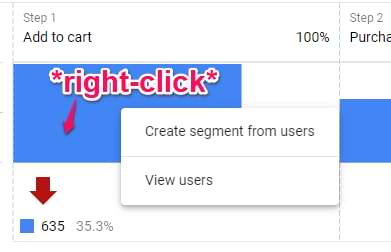
If you right-click on any bar in the chart, you can create a segment from those users or you can view them in the User Explorer report.
You can also right-click on the abandonments in the chart (but only certain parts of that are clickable). The red arrow (as of the moment of writing this blog post) is not clickable. But if you click the number below it, you’ll see some options.
Another clickable thing is the cells in the table below the funnel chart. Here, you can create segments and view users/abandonments.
Note: you cannot create segments via right-click if your funnel is set as an Open Funnel.
#2. Example of Funnel Exploration Report in Google Analytics 4
Let’s take a look at one funnel example. Thanks to it, we will see how many people saw at least one product (on the product page), then how many of them have added at least one product to a cart, and finally, how many of those did make a purchase.
For this report to work, you should have Ecommerce tracking implemented in your GA4 property. If you don’t have this, you can still follow this tutorial by using the official GA4 demo property. The demo account has full e-commerce data and is the perfect place to practice building reports.
Here is the configuration of the funnel exploration report.
- Technique: Funnel exploration
- Visualization: Standard Funnel
- Breakdown: Device Category
- Steps:
- view_item (the GA4 ecommerce tracking requires this name)
- Then, it is indirectly followed by add_to_cart (the GA4 ecommerce tracking requires this name)
- Then, it is indirectly followed by purchase (the GA4 ecommerce tracking requires this name)
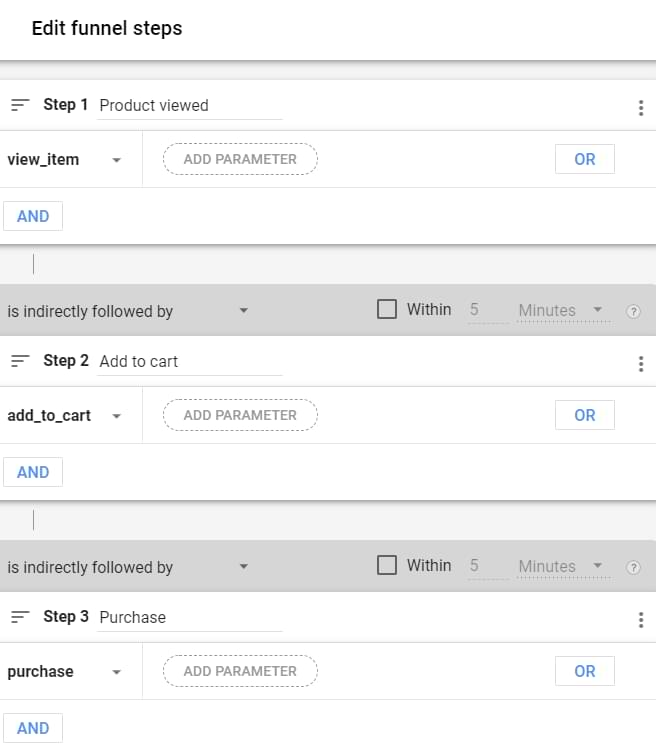
All other settings remain unchanged. Here is how the tab settings look after everything is configured.
#3. Open vs Closed funnels in Google Analytics 4 + how data is calculated
As I have mentioned before, your funnels in Google Analytics 4 can be open or closed. A closed funnel (this is the default option) means that a visitor can enter the funnel only in the first step. He/she cannot enter the funnel in any other step.
On the other side, open funnels allow visitors/users to enter the funnel at any step (not just the first one).
The dropoffs in the funnel exploration report are counted when a visitor does not proceed to another step. If a visitor/user enters the funnel in the 1st step, then skips the 2nd step, and then completes the 3rd funnel step, that last step will not be counted, and the drop-off will be seen after the 1st step.
Visitors/users cannot skip funnel steps in Google Analytics 4.
To make things a bit easier to understand, I have prepared a visual example. These situations were taken from Google’s documentation, and I visualized them (thus hopefully making things clearer).
Google Analytics 4 property has tracked four users. And I have configured a funnel that consists of 3 steps. In the table below, you will see how each user completed the steps.

- User 1 completed all three steps
- User 2 entered the funnel at step B and also completed step C
- User 3 entered the funnel at step A, skipped step B, and completed step C
- User 4 entered the funnel at step C
Now, let’s take a look at how Google Analytics 4 will treat these actions when it comes to funnel exploration. Which steps will be counted?
#3.1. Open funnel
First, let’s start with the open funnel. The green checkmark shows which step will be counted in the funnel exploration report. Red X shows which one will not.

The reason we have so many green checkmarks is that this is an open funnel. Visitors/users can enter the funnel at any step.
The reason why User 3’s Step C was not counted is that the user skipped step B. In GA4 funnel exploration, funnel steps cannot be skipped.
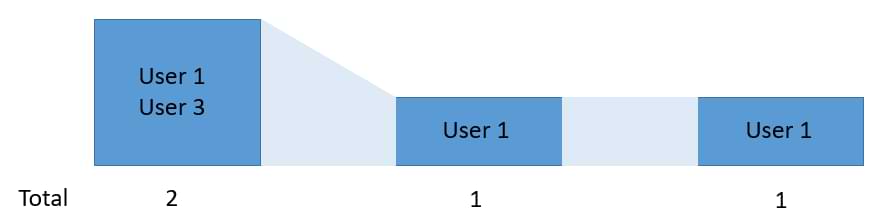
If we visualize this funnel with my poor design skills, it will look like this (also, I’ve labeled which user is counted where):

Those who enter the funnel later are displayed in a separate rectangle added on top of the existing bar in the chart.
#3.2. Closed funnel
Now, let’s take a look at the closed funnel. The users and how they completed funnel steps are the same as it was with the open funnel, but the funnel report is different

- User 2 was not included in the funnel report because he/she skipped Step A
- User 3’s Step C was not counted because Step B was skipped
- User 4 was not included because Step A and Step B were skipped
Visually, it would look like this:
#4. Additional things/reminders
Some of the following tips were already mentioned in this guide, but I just wanted to remind you about them quickly.
- If you go too far with the report and want to start from scratch quickly, click Start over in the top-right corner of the Explorations.
- Want to undo one change? Use the undo button (arrow back) in the top-right corner of the Explorations. Undid too much? Click the redo button (arrow forward).
- By default, your exploration reports are only visible to you. If you want to share the report (with Read-only permissions), click the Share icon in the top-right corner. Then other users who have access to the property will be able to see it as well (but not edit it) in the list of Explorations. If you want to change a report (created by someone else), you will have to duplicate the report first.
- A green shield in the top-right corner means that no sampling was applied to the report. If the shield is yellow, then sampling has kicked in.
- If you want to unshare the already shared report, you will see an unshare icon in the top right corner. You can also go to the list of all reports in the Exploration, click the 3 dots next to that report, and then un-share.
- Double-click on a segment/dimension in the Variables tab, and it will be automatically added to the Tab Settings column.
- Drag a segment/dimension over another segment/dimension (in the Tab Settings tab), and it will be replaced.
- Don’t forget to right-click on the actual report to see what kinds of options are available.
Funnel Exploration Report in Google Analytics 4: Final Words
Hopefully, this guide helped you to get started with this feature in GA4 Explorations. Here are the key takeaways:
- If you want to use a dimension/segment in the funnel exploration report, make sure it is included in the Variables tab of the exploration
- Funnels can be open or closed. Closed funnels require that people enter the funnel at the first step. Open funnels allow people to enter at any step.
- If a funnel step is skipped, that is a drop-off. Open and closed funnels behave here the same way.
- You cannot build audiences directly from the funnel report if the funnel is set to open.
- Do right-click on the funnel chart or the breakdown table to see additional options (like exploring users or building segments)
- You can zoom in/out of the chart while hovering your mouse over the chart (or use plus/minus icons in the corner of the bar chart)
- Play around with Show elapsed time, Next Action, Trended Funnel options
- Metrics cannot be customized in the report. Funnel Exploration Report in Google Analytics 4 reports on user counts.
18 COMMENTS
Hello Julius, thank you for great content. I have a question, is it possible to create funnels by excluding events?
I want to create a funnel of started but never login to my app. So I have 3 events: first_open, login_screen, after_login_screen. I am adding first two events but for the third one I should exclude. I can't see exclude event function for a step.
Try building an audience/segment and using that in the funnel
Hello Julius,
Thank you for this informative article. I got a question. If I set my breakdown as date, is it possible that I could sort my breakdown, date in this case? Thank you.
Hi, you cannot sort that
I seem to be unable to set a date range longer than 2 months. Is this normal? I have never encountered this in other GA products
Yes, explorations have a limited time window.
Hey, I wanted to know if it is possible to add metrics in Funnels!
The only metric that is supported by GA4 funnels is users
Hi Julius,
Thank you for all this intel. I'm trying to create a funnel exploration starting from a Landing Page>generate-lead.
The data always disappear when I try to simulate the generate_lead dimension as a second step. Could you give me an advice please?
Best regards.
Difficult to answer without auditing your setup
Hi Julius, thank you for all the content you provide on Google Analytics.
Just wanted to check if it is possible to sort data by "Dimension" in GA4 Exploration?
In funnel exploration?
What are you solutions if your funnel is longer than 10 steps?
GA4 is not an option then. You should look for another tool to visualize that funnel.
Hi Julius, thanks for nice article.
I have question - How can we add session count as metric? Just like they have given user count as a metric bydefault
Thanks
not at the moment
Hi, Julius
thanks for sharing this article, quick question, what is the difference between directly followed and indirectly followed by, i felt this is something similiar as open and close funnel? directly means closed funnel, and indirectly act similarly as open funnel, but when i tried to use directly followed, the users count is much lower than closed funnel, very confusing.
Thanks
Yu
Thank you for this use full article. quick question can we ad session source also.