
January 1, 2026
A Guide to Acquisition Reports in Google Analytics 4
Updated: January 1st, 2026
One of the most common use cases of Google Analytics is to view where your visitors are coming from. Even though Google Analytics 4 can show this data, some parts of the interface might be confusing compared to the previous version, Universal Analytics.
That’s why I decided to publish this blog post explaining how to use Acquisition reports in GA4.
Acquisition reports in Google Analytics 4 detail how visitors arrive at your website. They are divided into two main categories:
- User acquisition: Shows how new users found your site for the first time.
- Traffic acquisition: Shows the source of all sessions, including returning visitors.
These reports are useful for evaluating marketing performance across channels like Organic Search, Paid Ads, and Email.
Also, at the end of it, I will share several tips to help you work with these reports faster.
Table of Contents
Here’s what you will learn in this article
- Why are these reports important?
- Overview
- Navigating acquisition reports
- Default channel grouping
- User Acquisition vs Traffic Acquisition
- Do not use Source, Medium, Campaign
- How to customize acquisition reports?
- Additional tips
- Final words
Video tutorial
If you prefer video content, here’s a tutorial from my YouTube channel.
Why are Acquisition reports important?
If you are not sure what you can achieve with these reports, here are several ideas.
Which channel drives the most revenue? What is a “top performer”? Well, this is up to you and your company to decide. If you are an e-commerce business, the top-performing sources will be the ones that generate the most sales/revenue and generate the most email subscribers. By identifying them, you might try to raise the hypothesis of what is common among top performers. Then try to replicate that success in other marketing channels (if possible).
Where am I getting traffic that doesn’t convert? Instead of focusing on “what works best”, you can focus on “what performs the worst”. That might help identify weak spots that should be fixed. For example, you can check which traffic sources have more than 10000 monthly visitors, but convert worse than average.
Another example of weak spots could be traffic sources that get a lot of traffic but have a low engagement rate. That might indicate that the landing page may not meet the visitor’s expectations.
Which ads are generating leads? With UTM parameters, you can mark your marketing campaigns with specific parameters (like utm_source, utm_medium, etc.). When that data is collected by GA4, you can see the results in acquisition reports. For example, which campaign/ad generated the most leads for your business?
Overview of Acquisition reports
You can find these reports by going to Reports > Acquisition. By default, there are three options:
- Overview
- User Acquisition
- Traffic Acquisition

Overview is a dashboard of what’s going on with your website traffic. You will find a bunch of widgets (cards) there. Most of them also have links that will open a more detailed report.

If you have connected Google Ads or Search Console to your Google Analytics 4 property, additional cards will be displayed in the overview.
User acquisition and Traffic acquisition reports will give you more details about traffic sources.

Navigating acquisition reports
Let’s go to Traffic acquisition. Here, you can change the primary dimension at the top-left corner of the table…

…or you can add a secondary dimension by clicking the Plus icon.

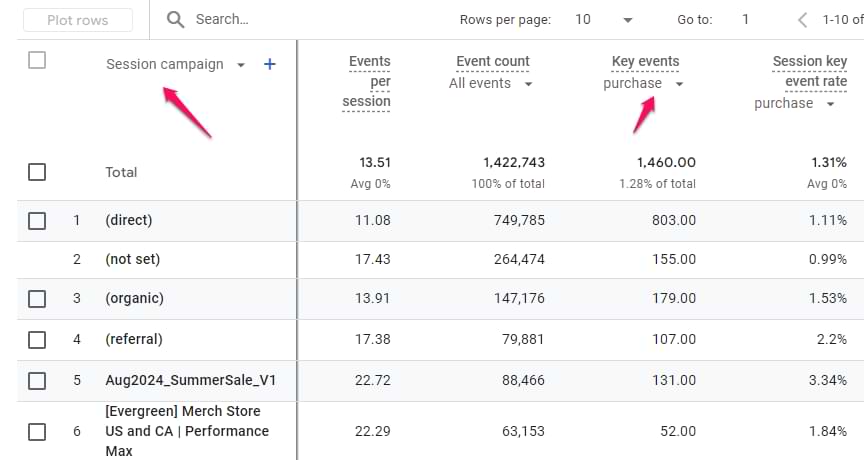
For example, in the Traffic acquisition report, let’s see what campaigns perform best. In this context, let’s say that the “best performer” means “drives the most conversions (key events)”.
In the drop-down menu of a primary dimension, select “Session campaign”.

Now, scroll horizontally and see how many key events (previously known as conversions) each campaign drove. If you want to be more specific, you can select a particular key event name.
If some of the metrics aren’t useful for you, you can customize the report (I’ll talk a bit about that later in this blog post).
If you want to see source/medium and campaign at the same time, you should first select Session source/medium as the primary dimension and then click the Plus icon. Go to the Traffic source and then select the Session campaign.

And done! You now see the list of all campaigns and their performance.

You can also use a search feature above the report table. It looks for partial matches in the first two columns (dimensions).
For example, here’s how you can see all email campaigns. While having “Session campaign” as a secondary dimension and “Session source/medium” as a primary dimension, I just entered “email” in the search field. This matched all rows where “email” was mentioned.

Default channel grouping
The default primary dimension in Traffic acquisition and User acquisition reports is either Session default channel grouping or First user default channel grouping. It’s the way how Google categorizes various traffic sources into larger groups. For example, Organic search includes traffic from search engines that are recognized by Google. Read more about that.
Common channel groups you will see include:
- Organic search: Traffic from search engines like Google or Bing (non-paid).
- Paid Search: Traffic from ads on search engines (requires auto-tagging or utm_medium=cpc).
- Direct: Users who typed your URL or bookmarked your site (or, usually, when the source is unknown).
- Referral: Traffic from links on other websites (excluding search engines and social media).
- Email: Traffic from newsletters (requires utm_medium=email).
If you want to learn more about what other groupings represent, read this documentation.
If you have some traffic sources that are not added to any grouping, they will be displayed as Unassigned.
Why is my traffic ‘Unassigned’?
If you see unassigned in your reports, it means GA4 could not match the traffic data to its standard channel rules. Common causes include:
- Missing UTM parameters: Links from emails or ads that lack utm_source or utm_medium tags.
- Incorrect UTM spelling: Using non-standard names (e.g., utm_medium=social-media instead of social).
- Measurement Protocol: Sending events without session parameters.
To learn more reasons, read this guide.
User Acquisition vs Traffic Acquisition
After browsing Acquisition reports for a bit, you might be wondering what the difference is between User Acquisition and Traffic Acquisition reports. The answer is that they attribute key events to different parts of a user journey.
The user acquisition report focuses on the first traffic source that led a visitor to your website.
The traffic acquisition report focuses on the most recent traffic source that led a visitor to your website.
If you are familiar with attribution modeling at least a bit, the user acquisition report uses first-click attribution while traffic acquisition uses last-click.
That is why if you look at the dimension names in those reports, you will notice that the User acquisition report’s dimensions start with First user… and Traffic Acquisition’s start with Session…

Let me explain the difference between these two reports visually.
Imagine that we have a visitor who first landed on our website from Google Search, subscribed to a newsletter, and then came back the next day from an email campaign.

In total, we have two sessions of the same user. However, the two reports will show different data.
- The user acquisition report will attribute both sessions to google/organic (because that’s the first source/medium the user came from).
- Session acquisition will attribute the 1st session to Google/organic, and the 2nd session will be attributed to email/newsletter (because the Traffic acquisition report cares about the traffic sources of each session individually).

Comparison: User vs. Traffic Acquisition Reports
| User Acquisition |
Traffic Acquisition |
|
| Scope | User: Focuses on how a visitor discovered your site for the very first time. | Session: Focuses on the traffic source of the current visit. |
| Attribution Model | First-Click: Credit goes to the first source. | Last-Click (Non-Direct): Credit goes to the most recent source. |
| Dimension Prefix | First user… (e.g., First user source) | Session… (e.g., Session source) |
| Best For | Understanding initial brand discovery and top-of-funnel marketing. | Evaluating re-engagement campaigns (email, retargeting) and immediate conversion drivers. |
Do not use Source, Medium, Campaign
Google Analytics 4 has three types of dimensions related to traffic sources:
- The ones that start with “First user”
- The ones that start with “Session”
- And the plain ones, e.g., Session, Medium, Campaign, etc.
This can be confusing, but if you want to see sources, mediums, or campaigns of your *sessions*, you need to use dimensions that start with the word Sessions.

Don’t use plain Session, Medium, Session/Medium, Campaign, and other similar dimensions. They use event scope, which is not what you are looking for. You are looking for session-scoped or user-scoped dimensions, so it’s important to use dimensions that start with that word.
How to customize acquisition reports?
I am not a fan of the default settings in the acquisition reports. Charts are not useful, default dimensions are not the ones I often use, and some metrics are unnecessary or missing.
If you feel the same way, this chapter is for you.
Let’s say that we want to customize the Traffic acquisition report. First, open it and then click the Pencil icon in the top-right corner.

If you don’t see the icon, it means that you do not have enough permissions in that GA4 property.
A sidebar will appear on the right side. Click Dimensions. The default dimension here will be the Session default channel grouping. Personally, I like the Session source/medium more. Thus I would recommend clicking three dots next to that dimension and settings it as default.

If you want to add more session-related dimensions, you can do that by clicking Add Dimension. For example, the Session manual term (a.k.a. utm_term) or the Session manual ad content (utm_content) are worth consideration. Once you select the dimensions, click Apply.
Next, “the numbers”.
If you want to add/remove particular metrics, click Metrics on that very same right sidebar.

Click X next to the metrics you don’t find useful. And if you want to add additional ones, then click Add metric. Here you can select from a lot. For example, Ecommerce purchases might be useful if you want to quickly see how many times visitors purchased on your website.
If you want to change the order of dimensions/metrics, drag them with this icon.

Once you are happy with your modifications, click Apply.
Then charts. Personally, I don’t find the Bar chart useful, so I often disable it. The line chart could also use some improvements (e.g. I would like to see the total number of sessions, not just the top 5 sources). Maybe GA4 will fix this in the future, but maybe not. Who knows.
Anyway, if you want to hide a particular chart, click the Eye icon next to it.

When you have finished all the customizations, it’s time to publish these changes. Next to a date picker, click Save > Save changes to the current report.

Then click Save and done. You have now customized the report.
Additional tips
Phew! We’re almost at the end of this blog post.
For dessert, let me share with you a few quick tips (they might be obvious, but, hey, if even one reader benefits from this, I’m happy).
Zoom out
One of the problems I have with the GA4 interface is that tables are way too wide and don’t fit in on most of the screens. Thus horizontal scroll appears. And I don’t like that.
Many important metrics are on the right side of the table (like Key Events or Revenue). Sure, I can rearrange them, but maybe other metrics are also useful. I would like to see them all at once.
So if your screen is not large enough, consider zooming out. Yeah, I know, #captainobvious.
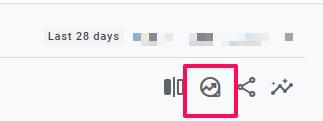
But in my opinion, this is an underrated tip. Zoom out a bit (e.g. by holding CTRL and – ). See if that makes the report a bit better. Also, you can hide the sidebar of standard reports by clicking here:

This will add some space.
Quickly replicate the report in Explorations
What if you prefer working with explorations instead? Like I do. Replicating the acquisition report from scratch will require a lot of clicks, which feels cumbersome.
Luckily, GA4 allows you to replicate a standard report in explorations with a single click.
When you are in a Traffic acquisition or User acquisition report, click this icon (it’s called Export this report to analysis).
Voilà! That very same report is recreated as a Free Form exploration.

That was a time-saver. But again, the table is too wide, and it does not fit on most screens. So consider removing unnecessary metrics, zooming out the report, or hiding the sidebars.
Acquisition reports in GA4: Final words
Now you are skilled enough to use acquisition reports and find what you need.
I admit that the interface is not as intuitive as it could be, and it requires some customizations. But once you’re past that, you will be navigating the interface with more confidence.
Some of the customizations I would recommend:
- Change the default primary dimension (if needed) to Session source/medium or First user source/medium
- Get rid of unused charts, they just clutter the view
19 COMMENTS
Hi,
I could not find google ads reports like where we can see google ads click, cost, conv, data
Have you connected google ads to GA4?
yes,
Then those reports will be visible as cards in the Acquisition overview
Ohh got it thank you so much!
So thankful for your explanation of User acquisition vs Traffic Acquisition!
A useful follow-up to this post might be to show how source parameters can be modified as data is received: in particular, the big one of merging the different facebook source types into a single parameter. Easy to do in UA with view filters, but I'm not so sure with GA4!
You can't do that in GA4
That's really bad. You can't help but think Google is forcing everyone into using a half-finished product.
Hello,
How I can check where the "unassigned" traffic comes from? I had a spike in this number in the last week which looks very odd. Any advice, please?
Thanks a lot.
Add a secondary dimension, e.g. Session source
If USER ACQUISITION = FIRST CLICK ATTRIBUTION
And TRAFFIC ACQUISITION = LAST CLICK ATTRIBUTION
Then why do we choose ATTRIBUTION type in the ACCOUNT SETTINGS. EX: Our ATTRIBUTION TYPE is set to DATA DRIVEN. Does USER ACQUISTION and TRAFFIC ACQUISTION take this into account?
Those dimensions do not care about attribution settings. Source/medium/campaign care about attribution settings
Hi,
How does first user source works if the first visit is out of date range used for the report ? In other words is first user source
- the source of the first session of the selected date range
- the source of the first session, even if it is out of the date range ?
2nd option
Hi Julius,
thanks for your informative videos and posts. They helped me a lot getting started with GA4 :)
Now I would like to analyse exactly where the traffic for a specific page came from.
Example:
The landing page xy (/products/xy) had 7.1K active users during the campaign period.
How many of these users came via which channel group? Paid search, paid social and display?
For that I've created UTM-parameters so that I can filter a specific campaign (session campaign = z)
When I look at the Traffic acquisition report however, I see that not all users land on the landing page linked in the ads, but on other pages of my website instead. How can that be?
My expectation would be that somebody who clicks on a link (with the parameter utm_campaign=z) will automatically land on the corresponding landing page first.
In other words: How do I get the exact number of Active Users per Channelgroup who came to the landing page? And what do I do with the others?
Thank you very much!
Hi Julious!
Thank you for the great post!
Could you, please, explain me the difference between Session manual source & session source? :)
According to GA4 help (not very helpful, by the way... :) ):
1. Session manual source. The manual Source that led to the session. The referrer. Populated by utm_source URL parameter.
2. Session source. The site that referred the user's session.
So... Does it mean that the manual one gets populated only when I'm using utm_tags? If I'm now using them it should be (not set), while session source would be populated by organic/referrer information?
Though according to this thread: https://support.google.com/analytics/thread/302829755/why-is-session-manual-source-in-user-acquisition-and-not-traffic-acquisition-in-ga4?hl=en
manual session source is only populated for the Acquisition reports, meaning that the manual session source is about utm_tags which were used only during the first ever session...?
Like if I'd like to know what exactly were used in utm_source or utm_campaign during the first ever session. But how it's different from the First source then? If there were no utm-tags then manual session source would be (not set), but First source still be populated?
Julius, I'm lost! Please, help :)
These reports are useful for evaluating marketing performance across channels like Organic Search, Paid Ads, and Email.