February 13, 2026
How to track and report AI traffic in Google Analytics 4?
Google Analytics’ standard reports often categorize visitors coming from AI platforms like ChatGPT or Gemini as general referral traffic. This makes it difficult to understand the true impact these tools have on your website.
As AI tools increasingly act as a new discovery layer, similar to search engines and social platforms, it’s worth taking the time to understand how they influence traffic and user behaviour.
In this article, you’ll learn how to identify, organize, and report on AI traffic in Google Analytics 4, resulting in more accurate data and clearer, more actionable insights.
Table of Contents
Here’s what you will learn in this article
- Create a custom channel group for AI tools
- View the data in a standard report
- Creating a customized report
- Dive Deeper with Explorations
- TL;DR
- Final Words
Video tutorial
If you prefer video content, here’s a tutorial from my YouTube channel.
Create a custom channel group for AI tools
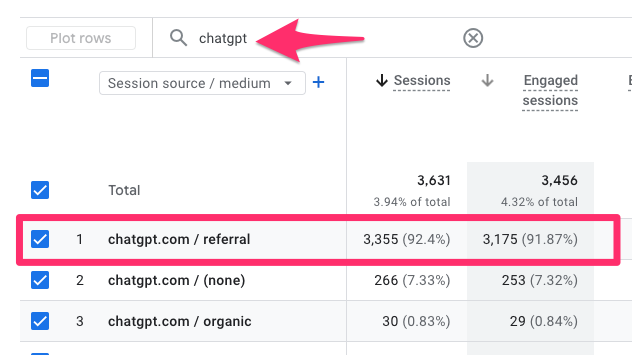
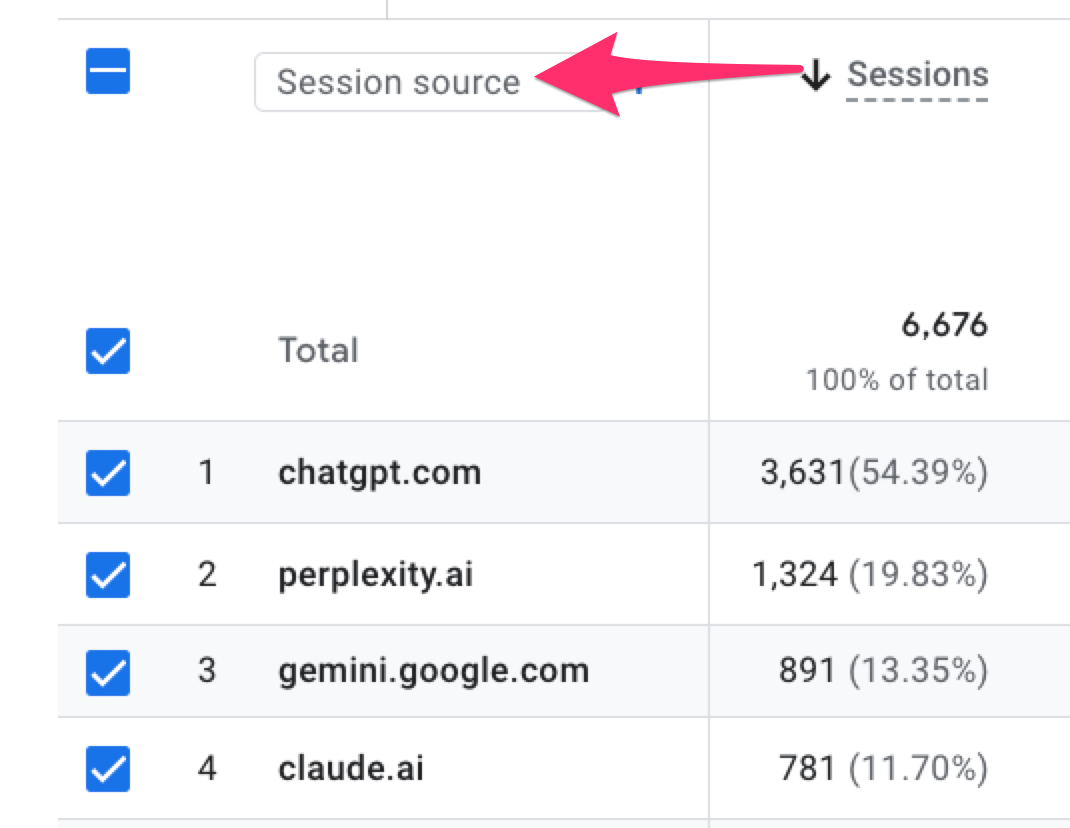
Normally, traffic coming from AI tools is grouped into the Referral default channel group in GA4. While this is technically correct, it makes it harder to quickly understand how much traffic is actually coming from AI platforms when you’re reviewing reports like the Traffic Acquisition report and looking at the Session source/medium (select this as the dimension from the drop-down in the table).
It’s also important to note that this approach only captures clicks that send a referrer. Not all AI-driven exposure results in trackable traffic, so what you see in GA4 will always be a partial view. Still, it’s worth organizing what is trackable so your data is as clear and actionable as possible.
The best way to recategorize this traffic is with custom channel groups in GA4. While you could apply a filter directly in the Traffic Acquisition report or create a custom version of the report, the filter character limit is quite strict. That limitation can make it difficult to include every possible AI tool. Custom channel groups give you more flexibility and scale much better over time.
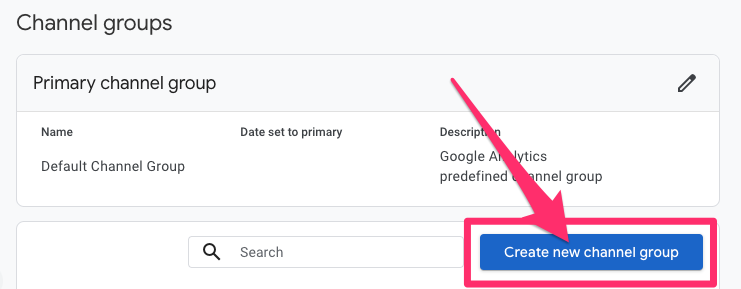
Note: You’re only able to create a maximum of two custom channel groups (one is reserved for the Default Channel Group), so be strategic about what groups you prioritize.
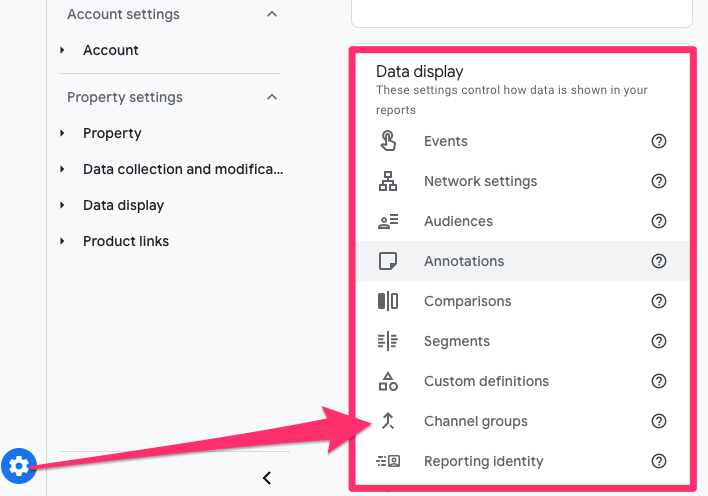
To create a custom channel group, go to Admin > Data display > Channel groups.
To create a new channel, click on the “Add new channel” button.
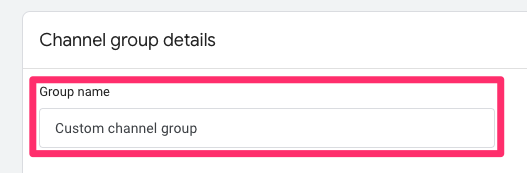
Name the new channel group, e.g. “Custom channel group”.
To create a new channel, click “Add new channel”.
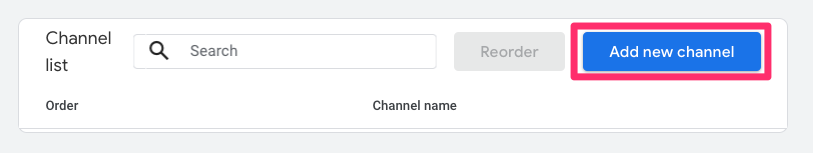
Some background information: A custom channel group can contain up to 25 channels. For each channel, you set a name and the conditions that determine what traffic belongs there. You can filter based on default channel group, medium, source, source platform, campaign ID, and campaign name. The exact setup will depend on how your data appears and how you want to analyze it in GA4 reports.

In this case, we will keep all the channels in there (you can remove any you don’t want) and just add a new channel:
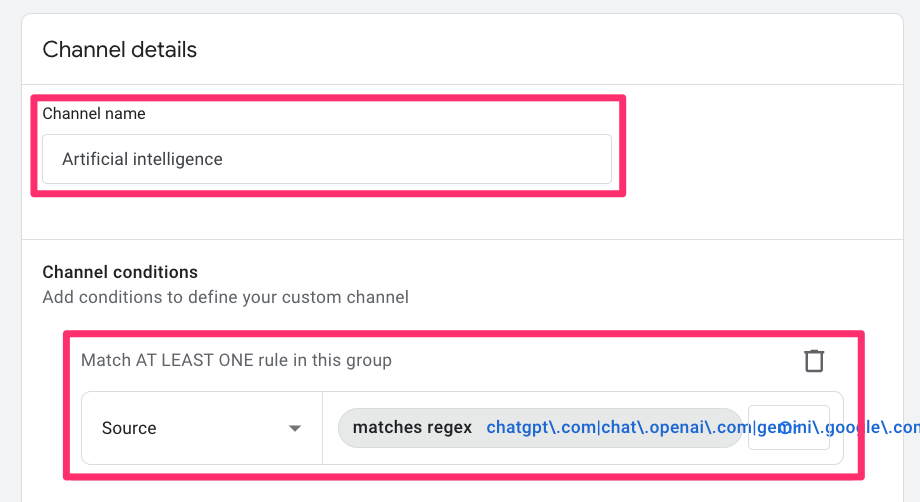
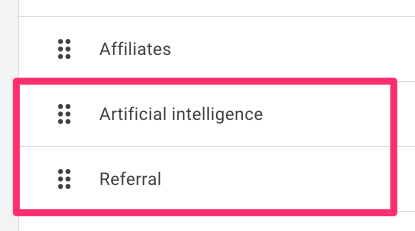
- Name the channel: Artificial intelligence. Using the full name instead of “AI” makes filtering easier later on.
- Set the channel condition: Source matches regex, and then paste the following regular expression:
chatgpt\.com|chat\.openai\.com|gemini\.google\.com|deepseek\.com|perplexity(?:\.ai)?|claude\.ai|copilot\.microsoft\.com|deepl\.com|character\.ai|(?:\w+\.)?meta\.ai|grok\.x\.com|grok\.com|x\.ai|bard\.google\.com|(?:\w+\.)?mistral\.ai|writesonic\.com|quillbot\.com|chat\.suno\.com|turing\.microsoft\.com|cosmos\.microsoft\.com|orca\.microsoft\.com|phi\.microsoft\.com|megatron\.microsoft\.com|jarvis\.microsoft\.com|maia\.microsoft\.com|aitastic\.app|bnngpt\.com|chat-gpt\.org|(?:\w+\.)?edgepilot|firefly\.adobe\.com|edgeservices|iask\.ai|(?:\w+\.)?neeva|nimble\.ai|open-assistant\.io|(?:\w+\.)?copy\.ai|openchat\.so|blackbox\.ai|ex\.ai|cohere\.ai|anthropic\.com|(?:\w+\.)?palm-ai\.google\.com|chatglm\.cn|gemini-api\.google\.com|palm\.google\.com|deeplearning\.google\.com|vertexai\.google\.com|ai\.google\.com|deepmind\.google\.com|ml\.googleapis\.com|tensor\.google\.com|t5\.google\.com|my-ai\.snapchat\.com|ai\.baidu\.com|xiaoice\.com|anthropic-api\.com|huggingchat\.com|deepmind\.com|alphacode\.google\.com|copilot\.azure\.com|felo\.ai|chat\.qwen\.ai|(?:\w+\.)?qwenlm\.ai|(?:\w+\.)?outlier\.ai|chat\.hotmart\.ai|customgpt\.ai|venice\.ai|bot\.ivy\.ai|chat\.chatbotapp\.ai|lmarena\.ai|wrtn\.ai|chat\.chaton\.ai|app\.chatboxapp\.ai|duck\.ai|sider\.ai|webpilot\.ai|ai21\.com|pi\.ai|zhipu\.ai|huggingface\.co|wordtune\.com|reka\.ai|syntesia\.io|jasper\.ai|uminal\.org|ai-coustics\.com|magical\.team|vicuna\.ai|floydhub\.com|forefront\.ai|komo\.ai|wav\.ai|d-id\.com|sap\.ai|useblackbox\.io|you\.com|chinchilla\.ai|openrouter\.ai|waldo|coze\.com|exa\.ai|spellbook\.rossintelligence\.com|yiyan\.baidu\.com|lighton\.ai|baichuan-ai\.com|hyperwriteai\.com|phind\.com|app\.loora\.ai
The settings should look like this:
Important note: When you save a new channel, it will go to the bottom of the list for that channel group. It is important to note that the order of the channel groups matters! Aka have your more general channels at the bottom of the list. Since Referral is a more general catch-all, you’ll want to make sure the Artificial Intelligence channel appears above Referral.
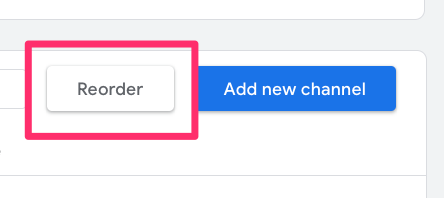
Click “Reorder” to move the channel into the best position.
View the data in a standard report
To view your new custom channel group, go to the Acquisition reports in Google Analytics 4 and open the Traffic Acquisition report. Because GA4 is highly customizable, your property may not look exactly the same as mine, and this report may live in a slightly different location.
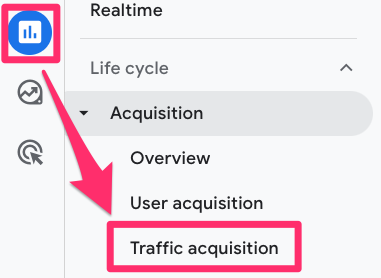
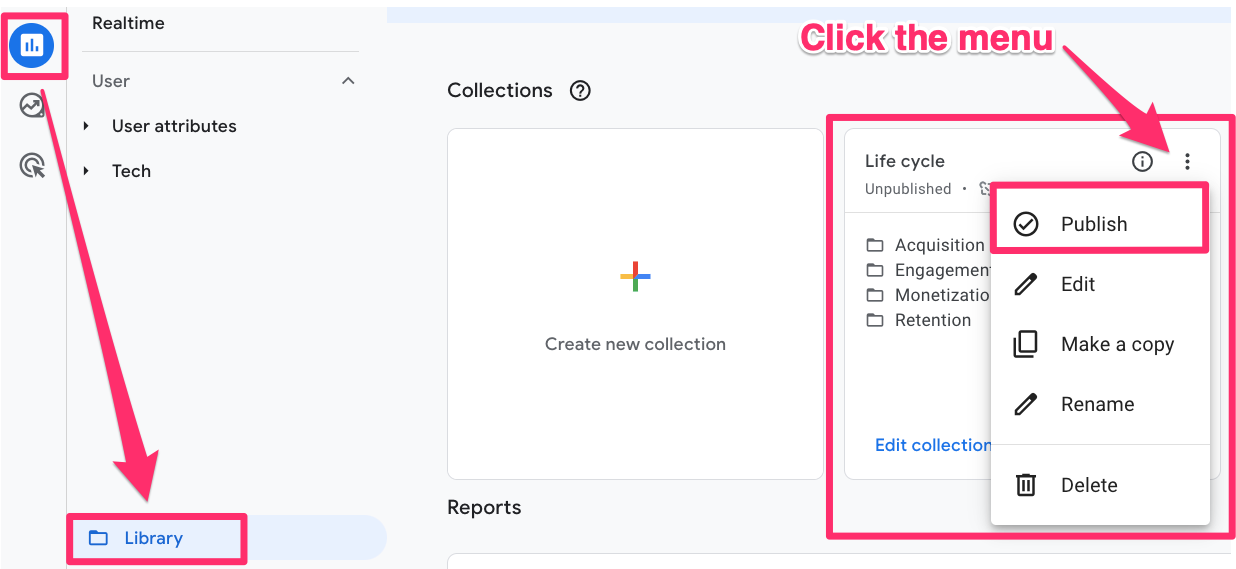
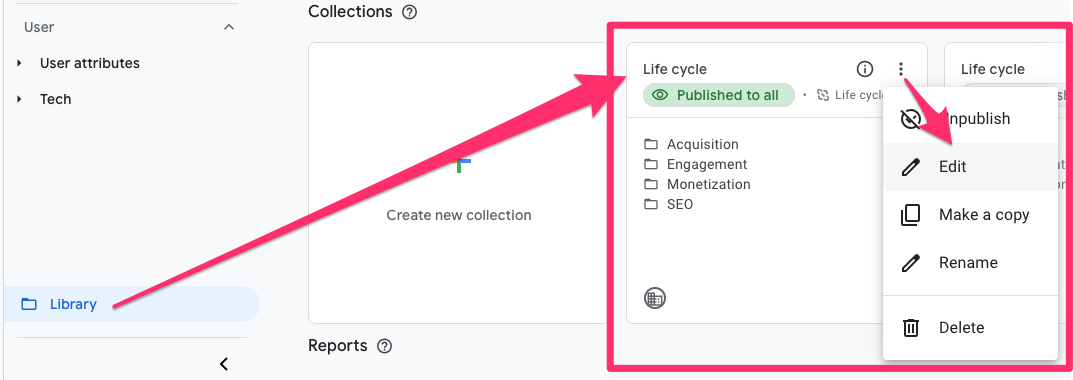
If you don’t see the Acquisition reports, you can add them by going to the Library and publishing the Life cycle collection.
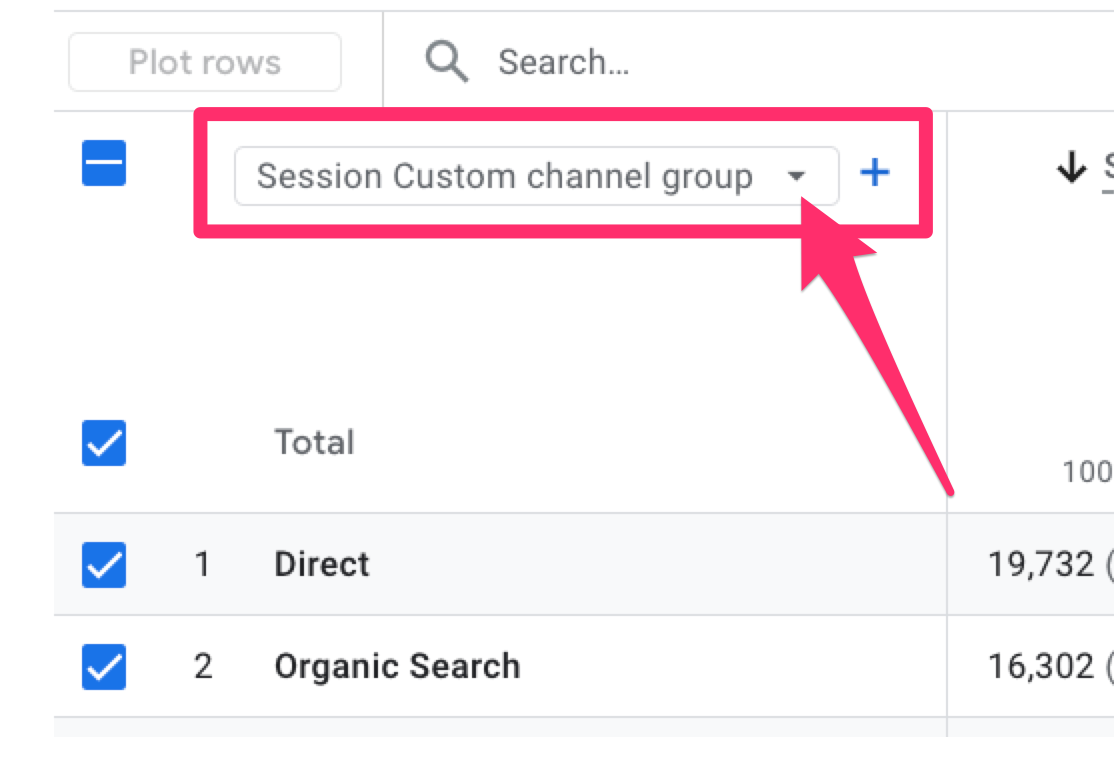
Once you’re in the Traffic Acquisition report, use the dimension drop-down in the table and select Session custom channel group.
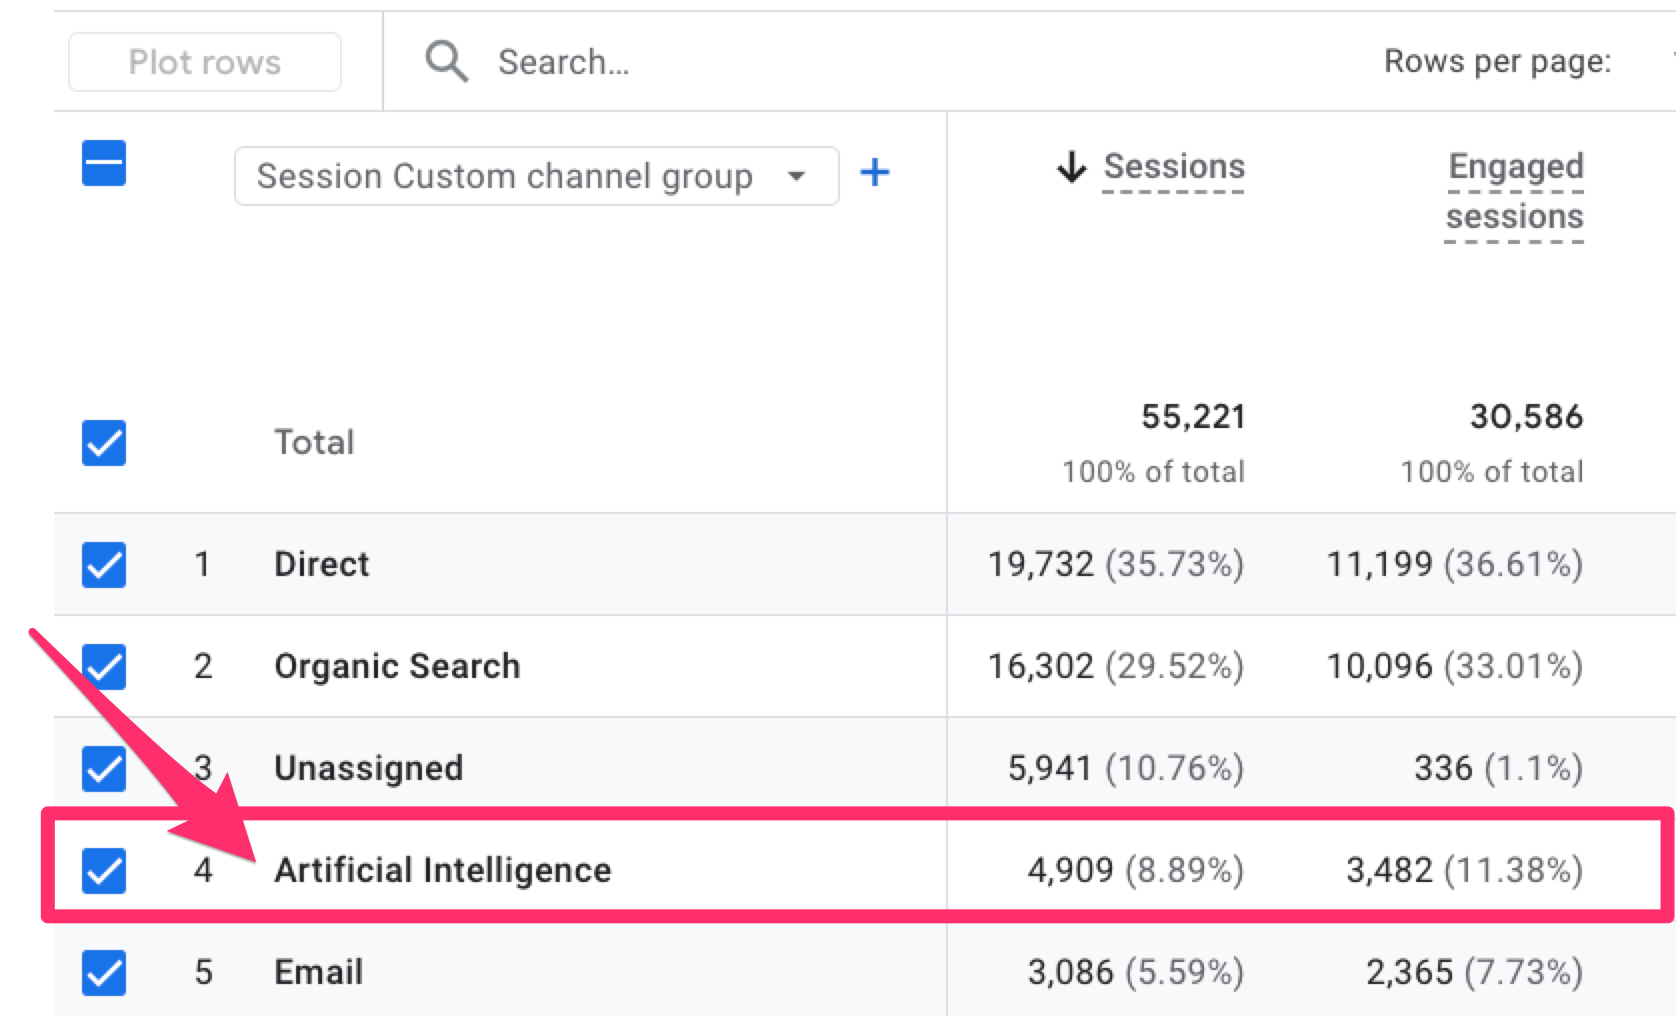
At this point, you’ll be able to see basic, aggregated metrics for AI-driven traffic alongside your other channels. This should be enough if your goal is a quick comparison between different channels, but we can take this a step further and dive solely into AI traffic by creating a customized report.
Creating a customized report
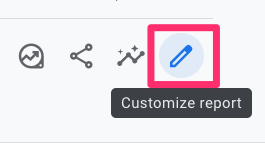
To dive deeper into AI-driven traffic, you can create a personalized version of the Traffic Acquisition report that focuses exclusively on your new custom channel. To do this, open the Traffic Acquisition report and click “Customize report” in the top-right corner (make sure you have Editor or Admin permissions).
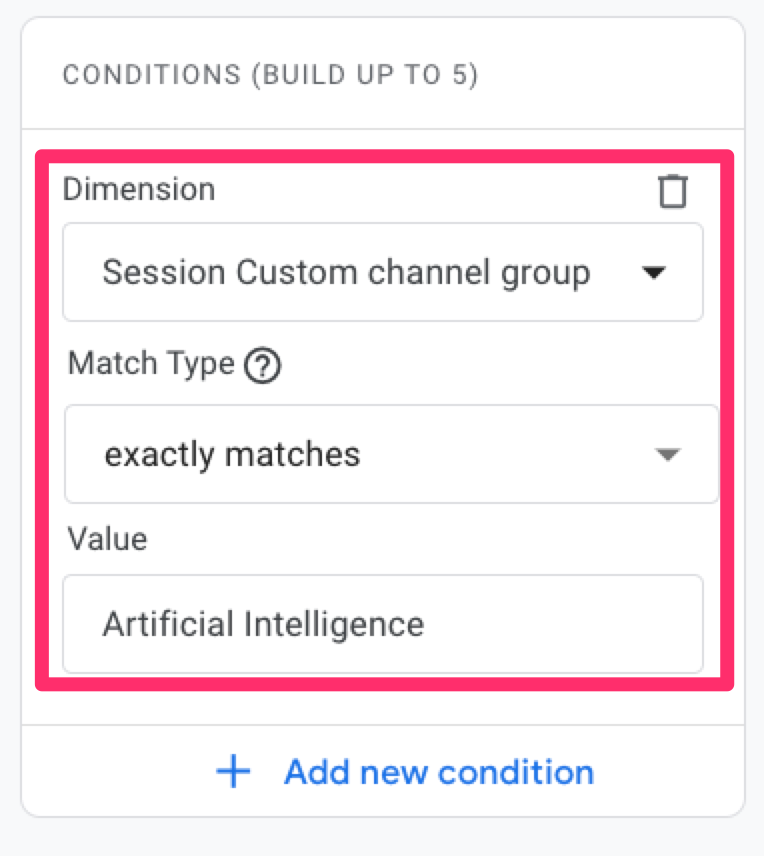
Start by adding this filter: Session custom channel group exactly matches Artificial Intelligence. Using the custom channel group here helps you avoid the filter value character limit you’d run into if you tried filtering on Source directly.
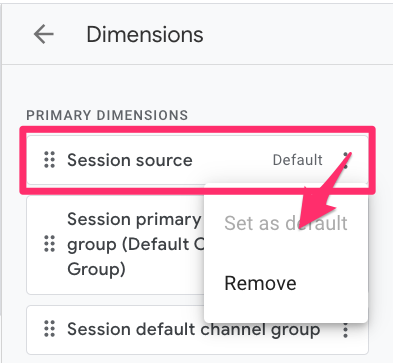
Next, set Session source as the default dimension and move it to the top of the dimension list. This makes it easier to see which AI tools are driving traffic at a glance.
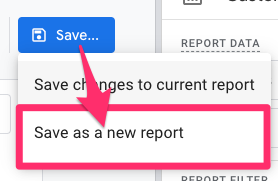
At this point, you can choose to customize the report further by adding or removing metrics, adjusting charts, or simplifying the layout based on what’s most useful for your team. When you’re done, save the report as a new report and name it “AI traffic”.
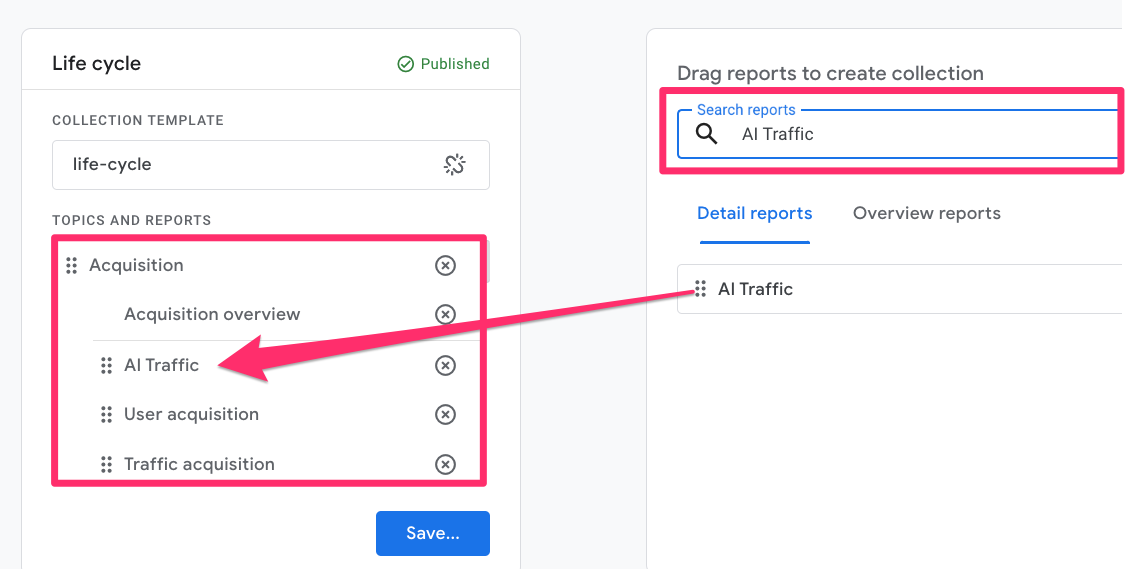
To make the report easily accessible, add it to a collection so it appears in the sidebar. Go to Library (at the very bottom of the Reports sidebar) > Life cycle > Edit Collection. You’ll add your report here to keep it with the other Acquisition reports.
Search for your report, and drag it under the Acquisition section and save the changes to the current collection.
Heads up! Once a report is added to a collection and appears in the sidebar, all users with access to the property will be able to see it. Make sure the report name is clear and descriptive so anyone browsing the reports understands its purpose.
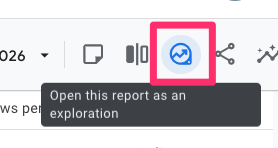
Dive Deeper with Explorations
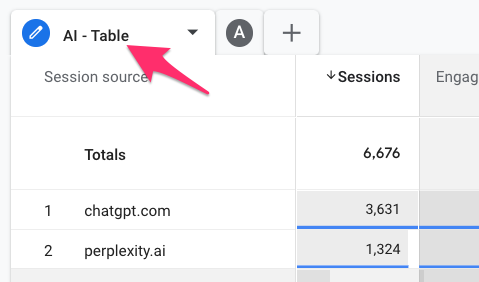
If you want to analyze this data in more detail, you can open the report as an Exploration. The quickest way to do this is by clicking “Open this report as an exploration” in the top-right corner of the report.
Each element in the report will be recreated as its own tab in the Exploration. You may end up with multiple tabs, which you can delete, duplicate, or edit as needed. You can also rename the tabs to make them more meaningful when you return to this report.
TL;DR
If you’re reading through all of this and thinking, “This is too much,” here’s the very short version. If you expect to look at this data more than once or twice, it’s worth taking the time to at least set up custom channel groups. That one step alone will save you a lot of frustration later.
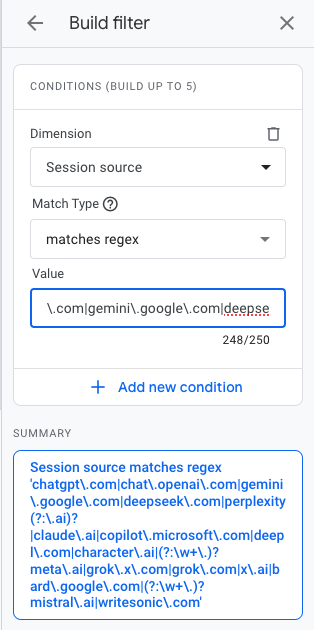
If you just need a quick answer, you can go to the Traffic Acquisition report and add a filter where the Session source matches regex using the following regular expression.
chatgpt\.com|chat\.openai\.com|gemini\.google\.com|deepseek\.com|perplexity(?:\.ai)?|claude\.ai|copilot\.microsoft\.com|deepl\.com|character\.ai|(?:\w+\.)?meta\.ai|grok\.x\.com|grok\.com|x\.ai|bard\.google\.com|(?:\w+\.)?mistral\.ai|writesonic\.com
This will capture most of the common AI tools (within a 250-character limit).
Just keep that as soon as you refresh the page or leave the report, the filter will reset, and you’ll need to apply it again (hence, the benefit of custom channel groups and custom reports).
How to track and report AI traffic in Google Analytics 4: Final Words
AI tools are quickly becoming a meaningful discovery channel, and leaving that traffic lumped into generic referrals makes it harder to understand what’s truly driving your results. The approach you choose for reporting on AI traffic depends on how you want to use the data and how often you’ll reference it.
To summarize:
- If you want a quick answer: use a report filter
- If you want something reliable over time: use custom channel groups
- If you want to really dig in: create a custom report and use Explorations
If you do something different to track and report on AI tool traffic, share your strategy in the comments below!

0 COMMENTS