
January 4, 2025
A Guide to Bounce rate in Google Analytics 4
Updated: January 4th, 2025
Bounce rate. Some people love it. Some hate it.
When Google Analytics 4 was introduced, bounce rate was not available (even though many people used it in the previous versions of GA). However, after a couple of years, it is back.
In this tutorial, I will explain what it is and how it is different from the previous versions.
Table of contents
– Hide table of contents –
- What is the bounce rate?
- How is it calculated in GA4?
- You can tweak it
- How to add it to standard reports in Google Analytics 4?
- How to add bounce rate to explorations?
- Final Words
Video
If you prefer video content, take a look at this tutorial from my Youtube channel.
What is the bounce rate?
Bounce rate is a metric that is designed to show how unengaged visitors of your website are. The higher the bounce rate, the worse it is.
How is the bounce rate calculated in GA4?
In the past, bounce rate was calculated as a percentage of sessions where there was only one pageview or interaction (event). But now, this has changed.
There are three different conditions. If at least one of them is met, the session is considered engaged. And in the context of bounce rate, if none of the following things happen during a session, that’s a bounce:
- A session consists of 2 or more page_view events
- A visitor stays at least for 10 seconds on a page (This can be tweaked. I will explain this a bit later.)
- A conversion happened during the session
When GA4 was launched, a new metric was introduced, engagement rate. The bounce rate is the opposite of that metric (100% – engagement rate).
You can tweak the bounce rate
As I have mentioned before, the bounce rate can be tweaked a bit. In Google Analytics 4 data stream’s settings, you can change the definition of an “engaged session timer”. The default is 10 seconds. But you can increase it up to 60 seconds.
And that’s what I would recommend. Personally, I think that staying 10 seconds on a page is not enough to consider this as an engagement. At least 30 seconds would be better.
What if I land on your website, stay for 11 seconds on a page doing nothing, and then leave? Would you consider me an engaged visitor?
If you think the same way, login to your Google Analytics 4 property and go to Admin > Data Streams > Select your web data stream.
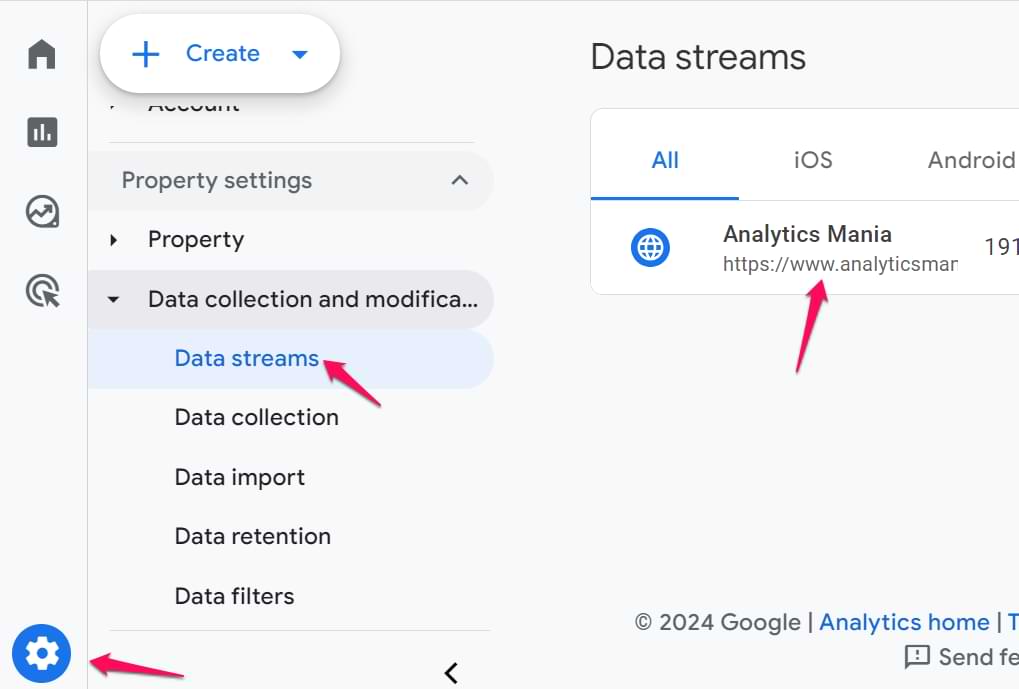
Then go to Configure tag settings > Show more > Adjust session timeout.
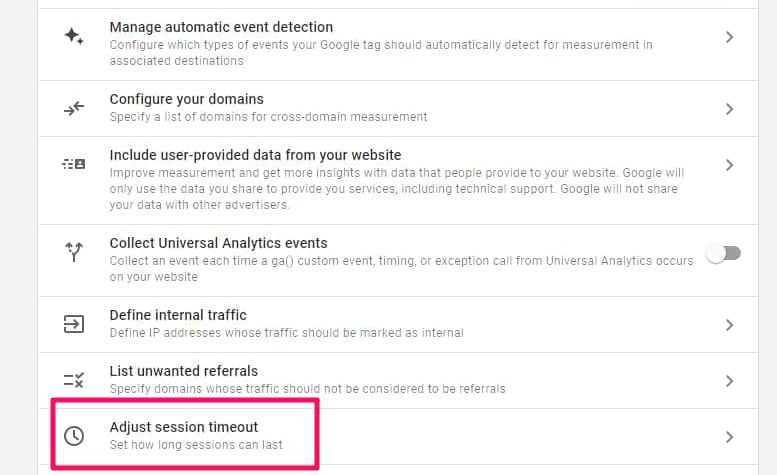
In the Adjust timer for engaged sessions, increase the number, e.g. 30 seconds or more.

Naturally, this means that fewer sessions will be considered engaged, and your bounce rate will go up. However, I think that this metric will reflect at least a slightly more realistic situation.

How to add bounce rate to standard reports in Google Analytics 4?
Now, you might be wondering how to add this metric to the reports (because, by default, it’s not there). To do that, you’ll need to customize the report.
For example, let’s go to Reports > Acquisition > Traffic Acquisition. In the top-right corner, click the pencil icon (Customize report).

On the right sidebar, click Metrics.

Then click Add metric and keep looking for Bounce rate. Once you select it, click Apply. Also, before you click Apply, you might want to rearrange the metrics.

Then click Save > Save changes to the current report > Save.
And that’s it! You have now added a bounce rate to the standard report in Google Analytics 4.
Since Bounce rate is the inverse metric of Engagement rate, it might not make sense to have them both in the report. So if you want, customize the report and remove the Engagement rate.
How to add bounce rate to explorations?
First, you need to be already (at least a bit) familiar with explorations. If you’re not, then read this guide first.
On the left sidebar, go to Explore and then select Blank.

Let’s build a report where we can see which campaigns have the highest bounce rate.
In the Variables column of your Free form exploration, click a plus in the Dimensions section.

Select Session campaign and hit import.

Click the Plus next to the Metrics and select metrics you want to include in the report, for example, Sessions, Total users, Bounce rate, and Conversions. Click Import.

Drag dimension into the Rows section and metrics into Values.

That’s it. You have now built a report where you can see campaigns driving the most traffic and how people are bouncing from them.

Bounce rate in Google Analytics 4: Final Words
Personally, I am not a big fan of the bounce rate (or engagement rate), but I also don’t hate it.
Some people (who want to satisfy their basic data needs) might find this useful. But personally, I would prefer my own definition of engagement.
For example, if a visitor stays on a page for at least 30 seconds and scrolls down at least below 50% of the page height, that could be an engagement. I explain how to configure this in my GTM/GA4 courses.
For a website that focuses on articles/blog posts, an engaged session could be the one where a visitor reaches the end of an article. You could track when a visitor sees the end and then send it as an event + a custom metric to GA4. Then you could see the number of times when this happens. Even though these custom examples would not affect bounce/engagement rate, this would still be useful to see in the reports.
So I am rooting for businesses who come up with their own definition of what an “engagement” really is.
2 COMMENTS
This is great thank you what i am struggling with is the vast different in bounce rate.
When i look at my pages report i get a much higher bounce rate then when i run the same report at channel level? Any ideas? So my page bunce rate for all site pages is at 50% but my average bounce rate when i break it down by traffic channel is only 25%?
Which is its the session count is the same?
How do you create a segment using bounce rate in GA4?