
March 5, 2024
Enhancing GA4 Without Extra Tagging: Leverage Server-Side GTM, BigQuery and Google Cloud for Improved Data Quality
This article was written by Doug Hall, who was kind to share his expertise with Analytics Mania’s readers. This is a really cool concept showcasing the power of Google Cloud Platform in digital analytics.
Google’s Privacy Sandbox is rolling out, third party cookies are in decline, first party cookies are coming under even more close scrutiny, and rightly so. Being mindful of regulatory and technology changes, there is an obvious need to double down on first-party data collection with a keen eye on data quality, but doing so with respect and consideration for users and their privacy.
Server-side data collection offers numerous advantages regarding privacy preservation and data quality improvements, especially around safe data enhancement. In certain circumstances, you might also see a reduction in the number of tags needed in the browser tag container. This is a good thing and doesn’t happen enough in my humble opinion.
I’m wholly in favor of the thin client. Doing less work in the browser through reduced tagging has a number of potential benefits:
- Less to maintain
- Lower page weight
- Faster to download
- Less work happening in the browser
- Better UX
- Eliminate 3P scripts
- Less risk of conflicts
And so on – less is more, right?

Table of Contents
Here’s what you will learn in this article
- You don’t need real-time all the time
- #1. BigQuery
- #2. Cloud Function
- #3. Firestore
- #4. Server-side Google Tag Manager
- #5. Reporting
- #5.1 Realtime
- #5.2 Custom dimension
- #5.3 Report filter
- #5.4 Explore
- Conclusion

You don’t need real-time all the time
In an effort to reduce client-side instrumentation, before you sprinkle in some shiny new tags, ask yourself:
Does the data require extra tagging? Do you have the implicit measurement to hand already?
For example, “tracking menu clicks” – firing an event when a user clicks a menu item to navigate or perform some other behavior of interest. Why? WHY?! Assuming the action is important to understand, and merits measurement, the destination or the outcome will be measured as a conversion anyway.
Click to go to a product detail page…hey, the product detail page view will tell you this happened. Do you have multiple routes to the same destination and feel the need to track mega menu vs footer menu clicks? Parameterize the path/fragment. Make the recorded value useful without having to add more click listeners. Link click listeners can ruin your users’ day, and hence your day will be 100x ruined too.
Rant over </mild_rant>. Realistically, sometimes, it’s very hard to avoid the need for extra tagging. For example, in a superb pair of articles on AnalyticsMania.com, user engagement measurement in GA4 is indeed shown to be doable – even on Single Page Apps . What was once a simple matter of configuration in Universal Analytics actually requires a chunk more thought and work for GA4.
It’s not all bad, though. With a customized solution, you have more options to consider for customization. You define the exact criteria for ‘engagement’. Use the dimensions and metrics you need. You also get to govern the cadence of engagement measurement.
Did you hear the penny drop?
Frequently, extra tagging is required to satisfy the thirst for data now damnit! Disappointment frequently follows when it transpires that real-time data and real-time activation aren’t always possible.
Consider the timing of your promotions, campaigns, and content marketing. They’ll be well crafted and carefully timed to build and maintain momentum. If that’s a weekly cadence in business-as-usual terms, that’s the timing the measurement needs to work to.
This means we don’t need extra tagging to measure page_view or other engagement events per session in real-time. Let’s automatically query and activate the data we have in BigQuery using the business rhythm to align the data collection cadence:
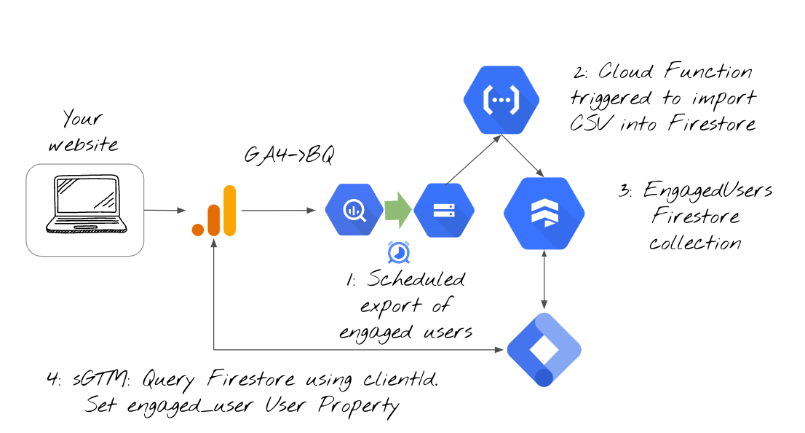
In a nutshell, the process will look like this:
- First, we schedule a query to extract engaged user data into a dedicated BigQuery table
- Then, we export the table as a CSV file to Google Cloud Storage
- After that, we’ll upload the list of engaged users to Firestore
- Finally, every time a GA4 request is sent to your server-side GTM setup, your server will query Firestore to check if the user is engaged (or not) based on the data that we exported in the previous steps. If the user is indeed engaged, then an additional user property will be sent to GA4. Basically, we will be enriching GA4 data without doing any additional configuration in client-side Google Analytics 4.
#1. BigQuery
GA4 can turn you into a power user almost literally overnight once you’ve connected GA4 to BigQuery. You’re taking huge steps towards seeing increased value from your analytics data. Let’s say you’ve taken the steps to connect your GA4 property to BigQuery, and now you can head over to https://console.cloud.google.com/bigquery?project=[your project id] and start asking serious questions of the raw data.
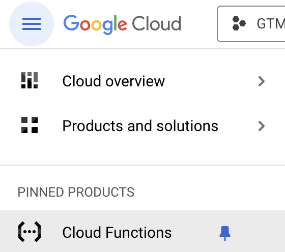
Click the burger menu at the top left of the page, and under “More Products”, find the BigQuery product (hint, it’s in the Analytics section):
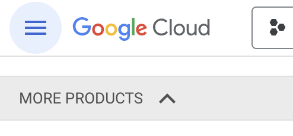
#ProTip: You might want to click on the pin as I have done to make finding the key Cloud Products a little faster and easier.
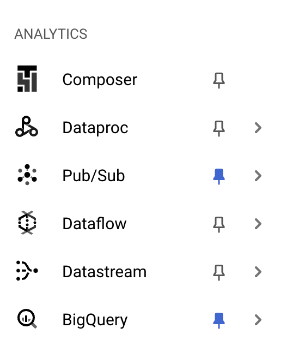
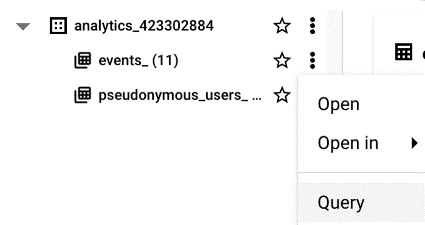
Once you’re on the BigQuery page, take a look in the “Explorer” tab on the left. You will see your project id with an arrow that you can click to expand and see your Data sets. Click the “analytics_’ Data set arrow, and as you’d expect, you see the events_ and pseudonymous_users_ tables:
Click on the kebab (3 dots) next to events_ and choose “Query”, you’ll be presented with a bare bones query – this is where we’ll make a few changes:
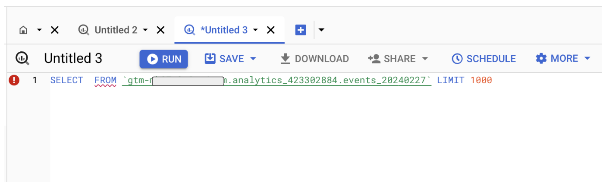
You could just pop a * in between SELECT and FROM like so to make your first working SQL Query:
SELECT * FROM `gtm-xxxxxxxx-xxxxxxx.analytics_423302884.events_20240227` LIMIT 1000
Click “RUN” and that will return the raw GA4 data from the latest day of data:
![]()
![]()
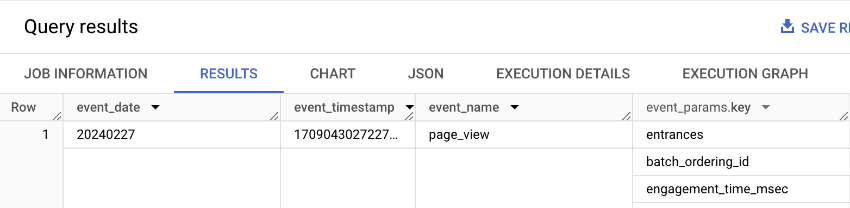
Not exactly “Big Whoop”. We don’t need all that data in that format – we only want engagement data – page view counts per user. Here’s the query we actually want to execute…Please don’t judge my SQL! Yes, it most likely can be done more efficiently, but for the sake of this small demonstration, let’s extract the clientId value and the number of pageviews per user in the last 24 hours
Copy the SQL below into your clipboard and paste it over the bare bones query. Notice the two highlighted parts where you’ll need to make changes. First, modify the Data set name to match your table name. You can see this in the bare bones query you created just now. Second, change the date. Your BigQuery data will lag by a day so put in yesterday’s date.
WITH PageViewEvents AS (
  SELECT
    SPLIT(user_pseudo_id, '.')[OFFSET(1)] AS clientid,
    COUNT( IF(event_name = 'page_view', CONCAT(user_pseudo_id, (SELECT value.int_value FROM UNNEST(event_params) WHERE key = 'ga_session_id')), NULL)) AS page_view_events_count
  FROM
    `gtm-xxxxxxxx-mjuzm.analytics_xxxxxxxx.events_*`
  WHERE
    _TABLE_SUFFIX BETWEEN '20240226' AND FORMAT_DATE('%Y%m%d', DATE_SUB(CURRENT_DATE(), INTERVAL 1 DAY))
  GROUP BY
    user_pseudo_id
HAVING
    COUNT( IF(event_name = 'page_view', CONCAT(user_pseudo_id, (SELECT value.int_value FROM UNNEST(event_params) WHERE key = 'ga_session_id')), NULL)) > 1
)

SELECT
  clientid,
  page_view_events_count

FROM
  PageViewEvents;
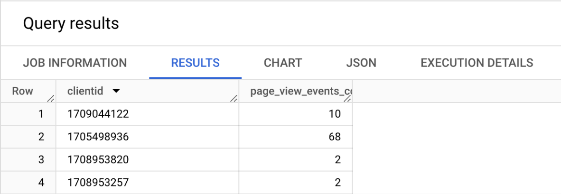
This query is a very crude definition of engagement. The first part of the query asks for the user_pseudo_id and the number of page_view events. Later, the HAVING clause makes sure the users returned have all seen more than one page. Yes, it’s that basic! Now run it, click the “RUN” button:
![]()
![]()
You’ll see the results of the query in the Query results tab at the bottom of the page – your results will look different to mine of course:
You will probably want to tune the definition based on your own requirements and you will probably want to expand the timeframe in a real world example as described above – tune the cadence of measurement to fit in with content updates, campaigns, and your normal business cycle.
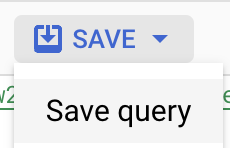
It’s a good idea to save this query for future use. It’ll save time. Hit the “Save” button and choose “Save query”:
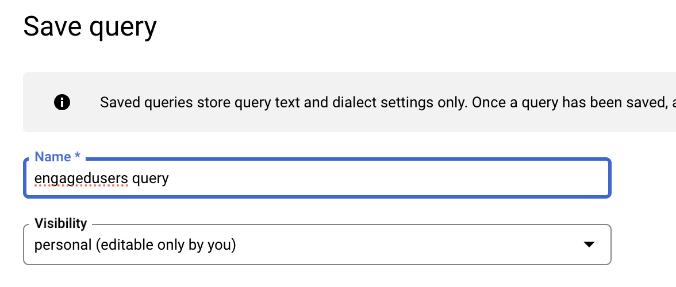
Give it a suitable name: and click “save”:
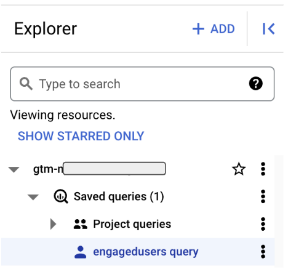
You can find the query in the Saved queries in your project in the Explorer:
For now, we’ll start the process to export this data to Firestore. Let’s investigate the steps involved in this.
#1.1. Export
Having executed the query, we can save the results in a variety of formats. We’re interested in exporting the results to a BigQuery table. It’s good practice to perform work on “curated data” – not the raw GA4 data. We need the result from the query to be in its own table which we’ll put in a separate Data set.
“Data sets are top-level containers that are used to organize and control access to your tables and views.”
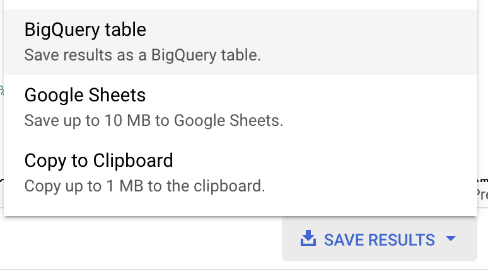
At the right-hand side of the Query results tab, find the “Save Results” link, and choose “BigQuery table”
Don’t worry about the red on the fields, it does that normally:
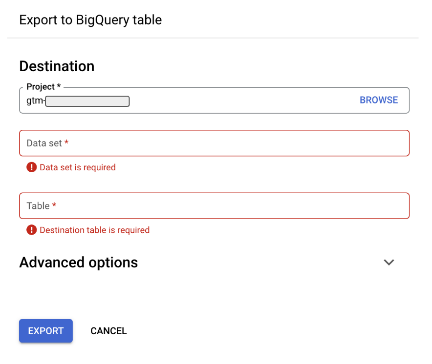
First, click on the Data set field:
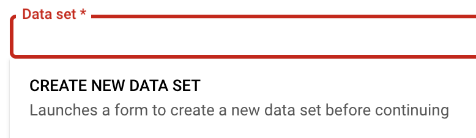
We need to “CREATE NEW DATA SET” so we’ll click that now. In the form that is presented, name it and select the region appropriate for your locale.
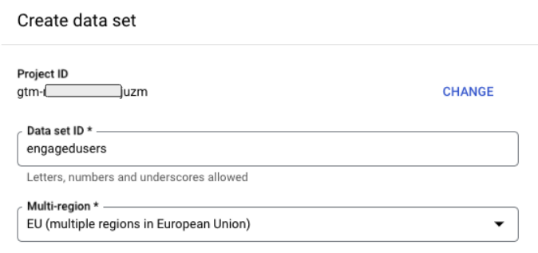
Click the “CREATE DATA SET” button. Having now created the engagedusers Data set, we can export the query results to a new table. We’ll just type in the name as “engagedusers”:
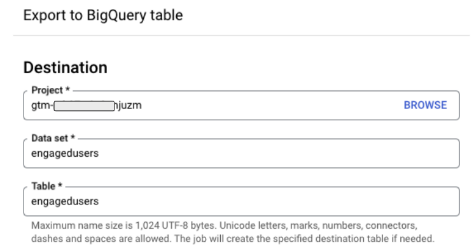
Click Export, and with that, we have a nice clean table:
![]()
![]()
Naturally, in production, you’d automate this so the table is refreshed according to the business rhythm. You can use something like a scheduled query – notice the “Schedule” menu item on the query tab:
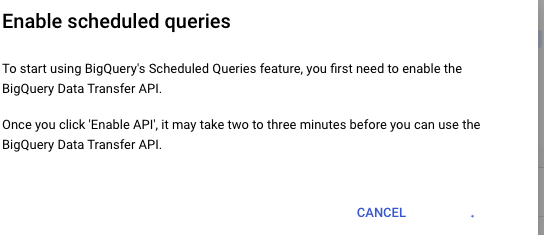
Click that, and BigQuery will show a dialog that asks you to enable the API – you only need to do this once:
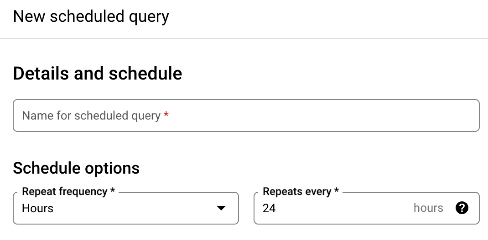
Then you can set a schedule to run your query:
Query scheduling is super powerful, but we don’t need to explore it any further in this demonstration. Read more on the Google docs.
#1.2. Cloud Storage
Recap: So far, we’ve queried BigQuery and have extracted a table of data showing the clientId and page view count for our engaged users. We need this data in Firestore so sGTM can query it in real time. There’s a couple of simple steps to achieve that, and very little code involved!
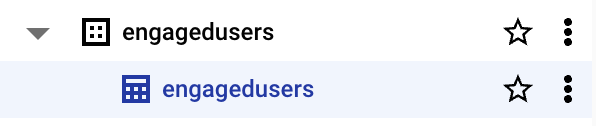
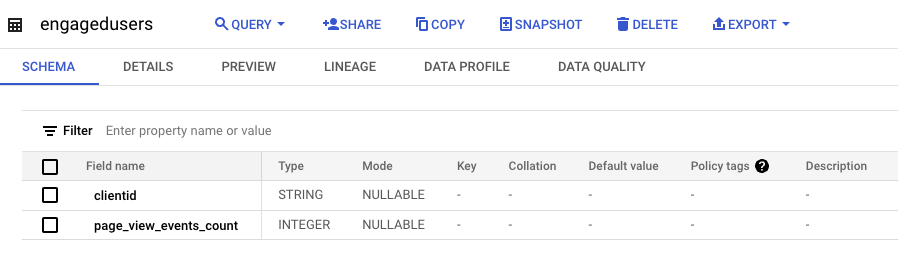
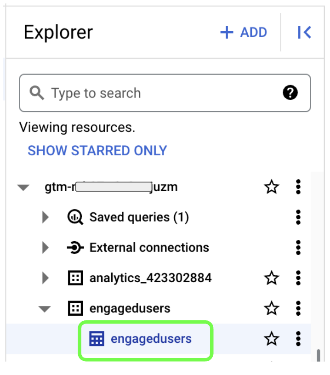
First, we’ll export the table to a CSV file in Google Cloud Storage (GCS). In the BigQuery Explorer tab. Click the engagedusers Data set, then click the engagedusers table name:
Now we can see our table schema, and on the right, we see the “Export” menu option:
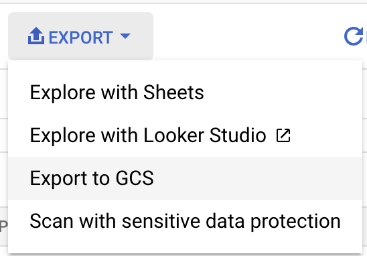
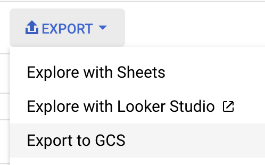
For this demonstration, the “Export” menu item will do just fine. For the automated version, a scheduled Python script, or DataPrep automation will do the job – have a chat with your friendly local data engineer, that’s a conversation for another day. We’re manually exporting for now, choosing “Export to GCS” as shown below:
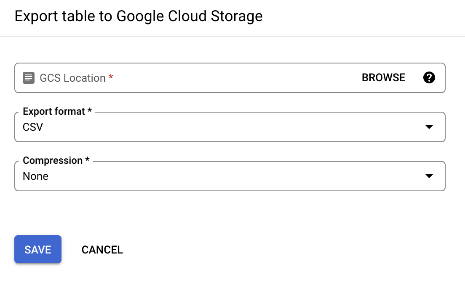
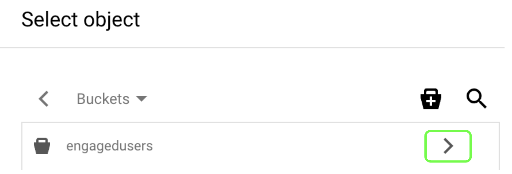
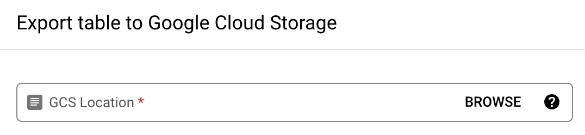
Google Cloud Storage (GCS), if you’ve never come across it, is the closest thing to a shared drive in Google Cloud. We have “Buckets” rather than folders though. That’s what the GCS Location field means:
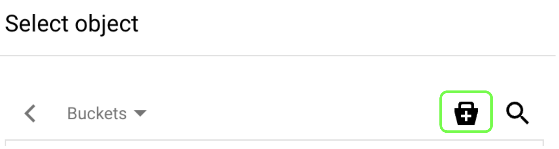
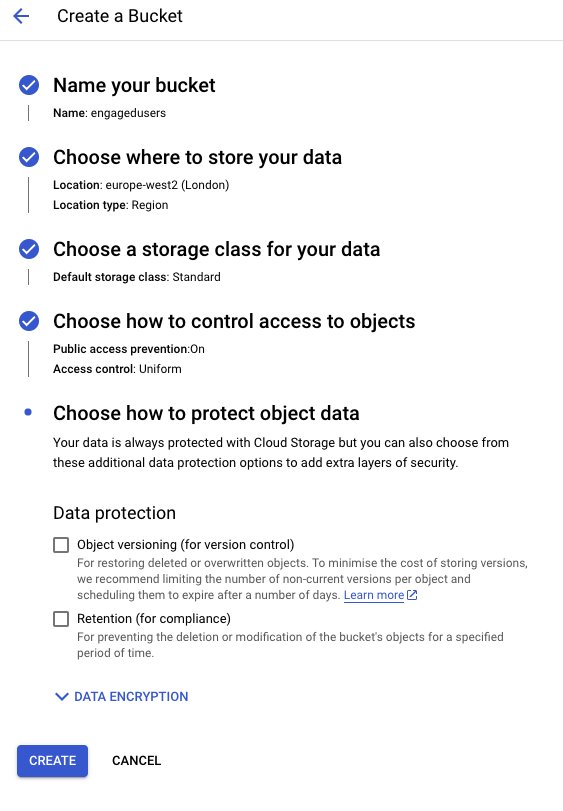
We don’t have any buckets for this purpose at the moment so we need to create our bucket before we can export the data. Click ‘BROWSE’ at the right-hand side of the GCS Location field. In the next pop up click the icon representing a “bucket” with a plus in the middle:
Now, we can create our bucket. Fill the form in as you can see it below – name the bucket, and make sure the region is set to the same as BigQuery (exporting from BigQuery in the EU to Cloud Storage in the US will cause issues). Nothing else to change here, so just hit “Create” at the bottom of the form:
Open a new browser tab (important, don’t skip this, and don’t close your other tab), and open your Google Cloud Console, click the top left burger menu, find “Cloud Storage” in “More Products” and click it:

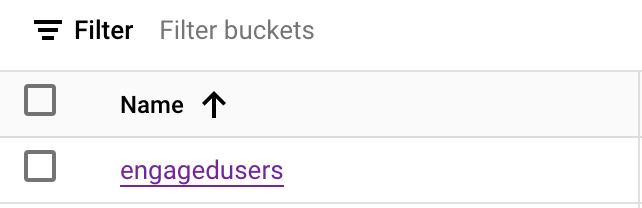
Now you’ve created the bucket. It’ll appear in the list of buckets:
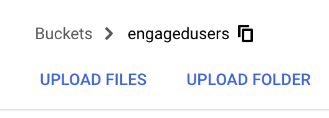
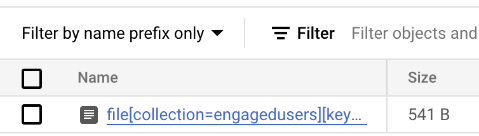
Click it, and we can see the empty bucket. We need to upload an empty file first. Create a CSV file on your local machine using your favorite text editor. You can use the file definition below. Make sure you save it as a CSV file – call it:
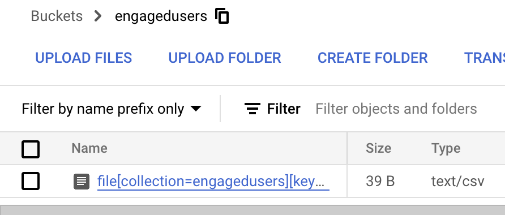
file[collection=engagedusers][key=clientid].csv
“clientid”,”page_view_events_count”
“0”,”0″
That file name is very important, as we’ll see in the next section.
Notice that the field names in the first row exactly match the field names in the BigQuery table. That’s important. Now, in the empty bucket screen, click “Upload Files”, choose the empty csv file you just created and upload it to your bucket.
See how tiny the file is? 39B at the moment, that’ll change later.
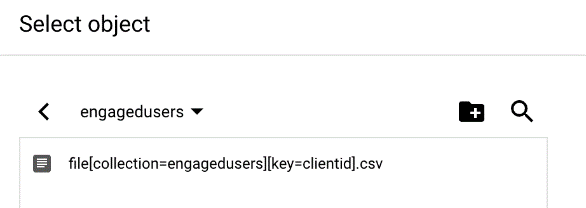
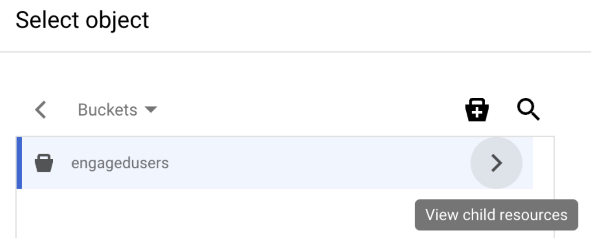
Remember the other browser tab we left hanging? We’d created the GCS bucket ready to export the BigQuery table somewhere. Now we’ve given it somewhere we can take the next step. Back in your BigQuery tag, click the arrow to the right of the engagedusers bucket:
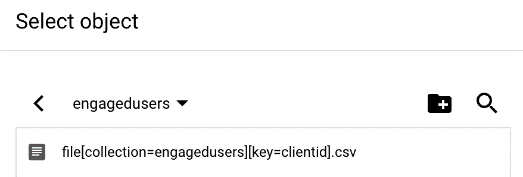
You’ll find the tiny file your uploaded ready to click:
And then click select:
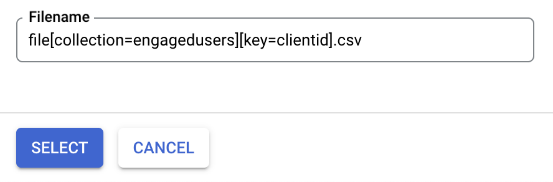
There, ready to export but don’t hit save just yet:
We’re nearly ready to export data from the BigQuery engagedusers table into our CSV file – but not quite. Use a new browser tab for the next section. We’ll come back to BigQuery to kick off the export after the next section. When the CSV file lands in Cloud Storage, that’s not the final destination. When the file lands, we need a piece of software to read it and insert the rows into Firestore. For that, we need a Cloud Function.
#2. Cloud Function
Cloud Functions, if you’ve never come across them before, are “a serverless execution environment for building and connecting cloud services”. They’re simple little scripts that connect Cloud Services and do work for us.
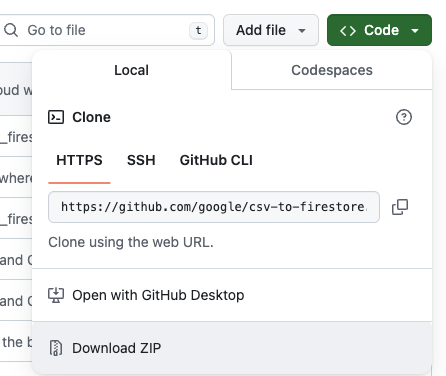
Good news: we’re not going to write our own Cloud function. We’re going to use the existing csv-to-firestore Cloud Function to upload our data from GCS into Firestore. Click the csv-to-firestore link, click the green “Code” button in GitHub and download the zip file:
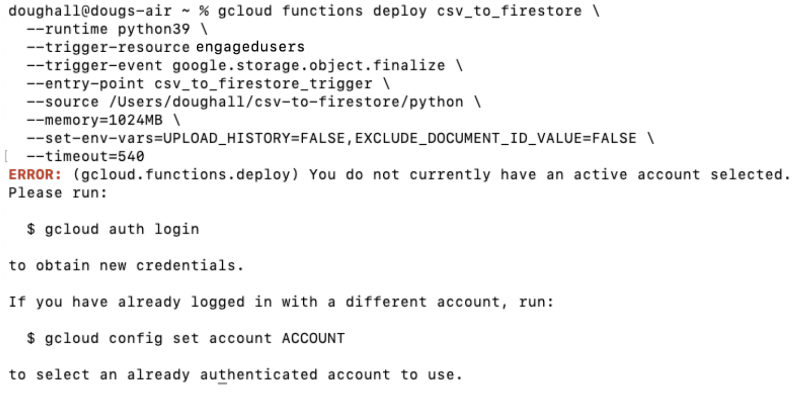
Unpack the zip file in your local folder – the exact destination isn’t too critical. Before we get into the deployment instructions, make sure you have the Google Cloud Command Line Interface (CLI) installed. Next, in your terminal, paste the install command from the deployment instructions – don’t execute it yet, we need to modify it:
gcloud functions deploy csv_to_firestore \
--runtime python39 \
--trigger-resource YOUR_TRIGGER_BUCKET_NAME \
--trigger-event google.storage.object.finalize \
--entry-point csv_to_firestore_trigger \
--source PATH_TO_SOURCE_CODE \
--memory=1024MB \
--set-env-vars=UPLOAD_HISTORY=FALSE,EXCLUDE_DOCUMENT_ID_VALUE=FALSE \
--timeout=540
YOUR_TRIGGER_BUCKET_NAME is engagedusers.
PATH_TO_SOURCE_CODE is where you unpacked the zip file to on your computer.
Here’s what my command looked like – notice that it asked me to login as this was the first time I’d done this – you may have to do the same:
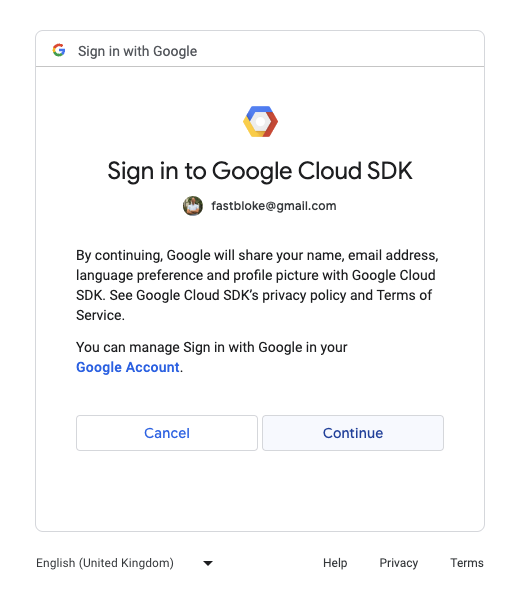
When you sign in to the Google Cloud SDK, you’ll see a simple pop-up where you click continue:
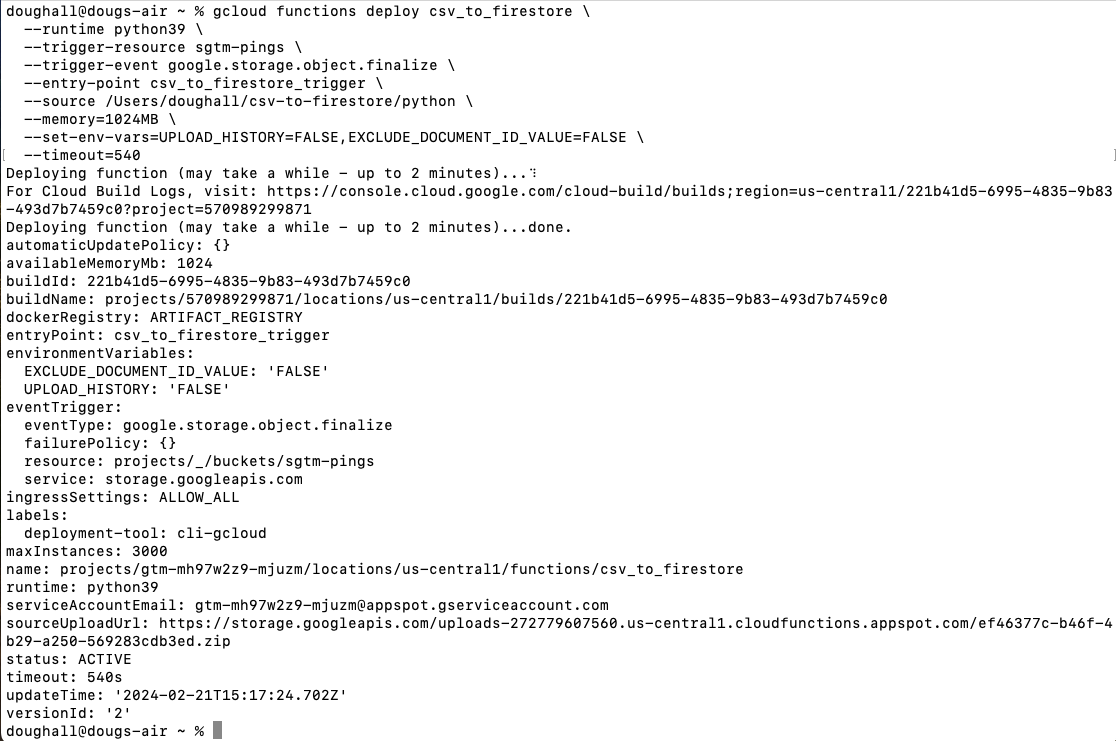
What happens now is seriously cool, but we don’t need to go into all the technical details. This is called terraform – terraform is an infrastructure-as-code software tool. There’s a script that sets up your cloud function for you without having to do all the hard work like becoming a qualified Cloud Engineer 🙂 It should look something like this:
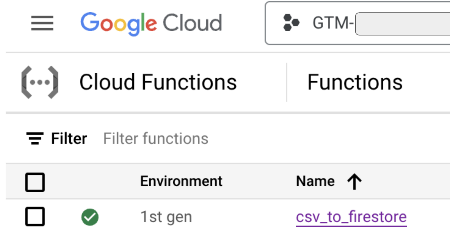
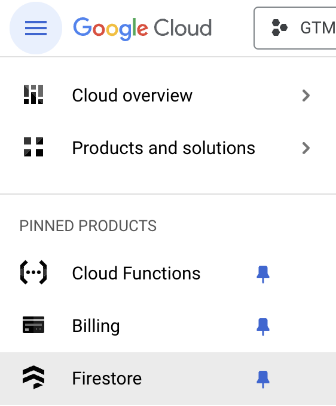
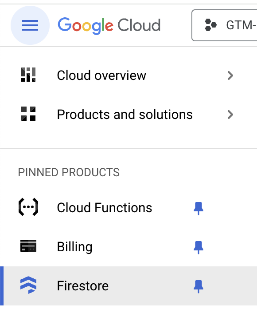
Once the script has finished, let’s go and take a look at the Cloud Function. In the Google Cloud Console, hit the top left burger menu, and click on Cloud Functions – no surprise, mine is in pinned products. You might need to scroll through More Products” to find it. When you do, pin it, and then click it:
Click the csv_to_firestore link under the name column.
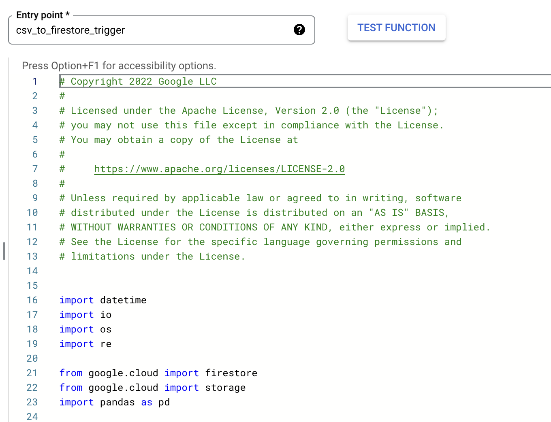
Then, on the Cloud Function csv_to_firestore page, click the “Edit” link next to the Function details label:
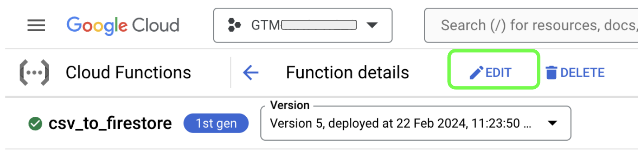
Notice the Trigger details:
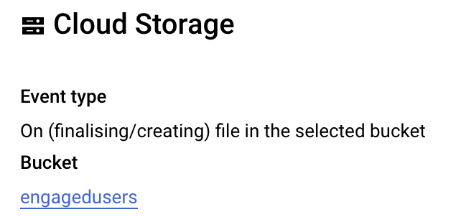
This means that when a file is dropped into our engagedusers Cloud Storage Bucket (like an exported table from BigQuery), the Cloud Function will perform its action. We need to make a small modification though, so click on the “Next” button at the bottom of the Trigger page.
Don’t freak out, but now we’re looking at actual real-life software. Proper code! We need to insert 5 lines to make sure the data is uploaded to Firestore as Strings. Server-side Google Tag Manager prefers Strings – not numbers.
Basically, it’ll look like this to start with:
To make life easy, you can go to this gist, copy the whole lot, and paste over the Cloud Function code.
Now, we can hit “Deploy” at the bottom of the screen. The deployment might take a couple of minutes. Once it has finished, we’re ready to trigger the Cloud Function to upload our data set of engaged user clientId and pageview values into Firestore.
First, a recap. Remember in Cloud Storage, we created a bucket called engagedusers and we uploaded an empty csv file called file[collection=engagedusers][key=clientid].csv.
Remember in BigQuery, we had a table called engagedusers in the engagedusers Data set that contained our engaged user data? We’re now even closer to exporting this data. When we export the data from the BigQuery table to the CSV in Cloud Storage, the Cloud Function will trigger and try to upload the data to Firestore. Now, we need to do the Firestore setup to give the Cloud Function somewhere to upload to.
#3. Firestore
If you’ve not come across it before, Firestore is “a NoSQL document database built for automatic scaling, high performance, and ease of application development”. It’s a simple and incredibly fast database.
Firestore is organized into collections of documents. The documents contain fields as name value pairs. We’re going to create a document per user using the clientid as the document key and the page_view_events_count will be the data in the document. That way, sGTM can easily query the Firestore database using the clientid _ga cookie value.
Before we can do that, we need to create the database. First, in the Google Cloud console, navigate to the Firestore page – handily pinned for me – you know the routine by now – pin it!
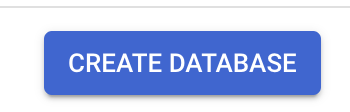
On the Firestore page, hit “Create Database”:

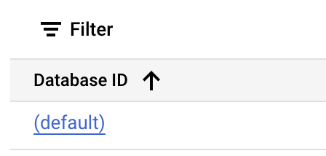
On the next page change nothing, and then hit “Create Database” at the bottom of the page – that simple!
Now you have the (default) database available – you’ll see it listed at the bottom of the page:
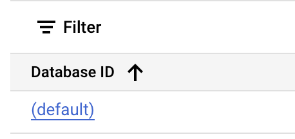
Click the link (default) and then hit “Start Collection” on the next page:
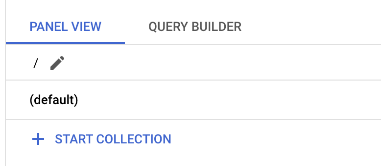
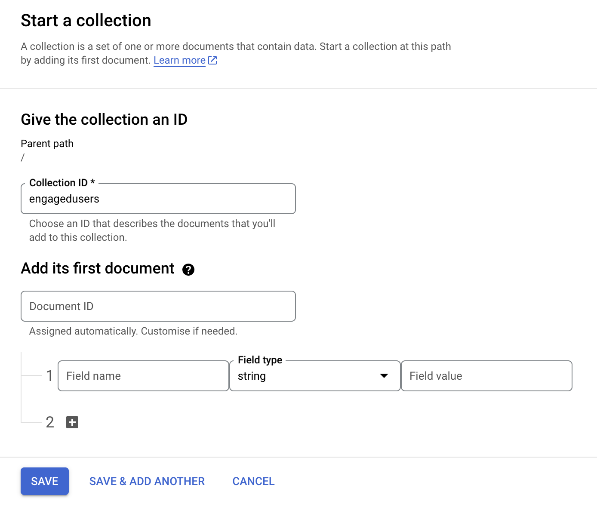
The reason for the specific filename format for the csv file is so we can tell the Cloud Function the name of the collection it needs to upload to, and which field to use as the key for the document’s names. As we’ve named the file file[collection=engagedusers][key=clientid].csv we’ll name the collection engagedusers. We don’t have to add a first document. We’ll let the Cloud Function upload the data, so we’ll just hit save when the form looks like this:
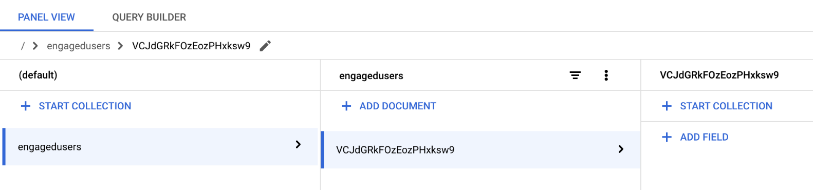
Now we have an empty collection ready to upload to. A document has been created, your document will have a different name, don’t worry, that’s normal, it doesn’t matter:
Now we’re ready to export, and upload into Firestore – exciting! Remember the BigQuery tab from earlier? Head back there, the right hand side should resemble this:
If you closed the BigQuery tab earlier, no worries, we can recap – it’s good learning. Use the burger icon in the top left to navigate back to the BigQuery page. In the Explorer, click your project, the engagedusers Data set, and then the engagedusers table:
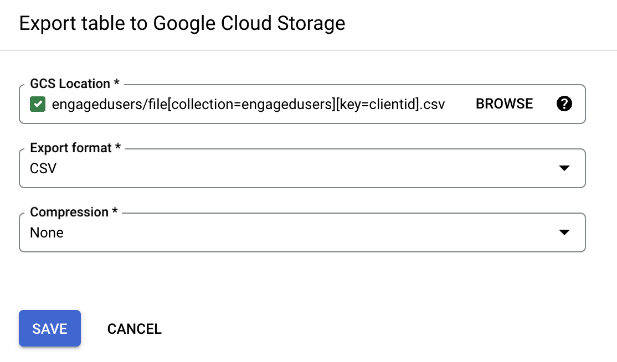
As we did earlier, click Export, and the Export to GCS:
Now we can click “Browse” for the GCS Location:
Having clicked Browse, now we click on the engagedusers bucket arrow:
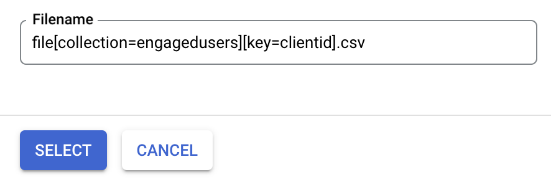
We chose our ’empty’ CSV file we uploaded earlier:
And hit Select at the bottom of the pop-up:
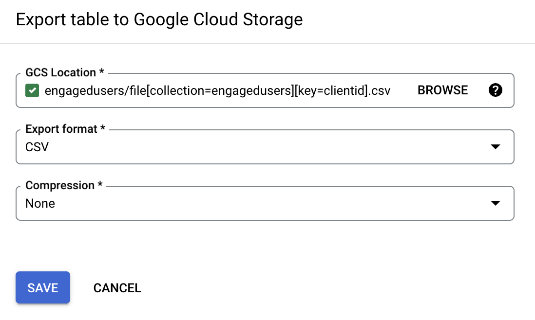
Cool, now our export config looks like this:
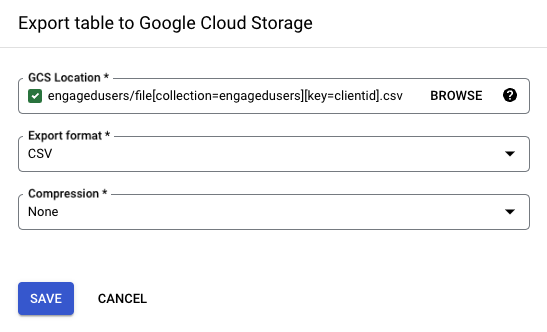
Whether you kept the BigQuery tab open, or you’ve gone through the recap: We will NOW click “SAVE” to export the data.
You’ll see the notification below at the bottom of the screen:
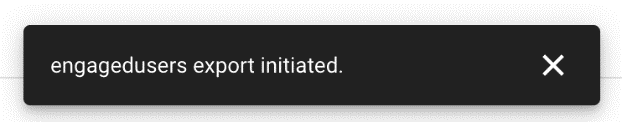
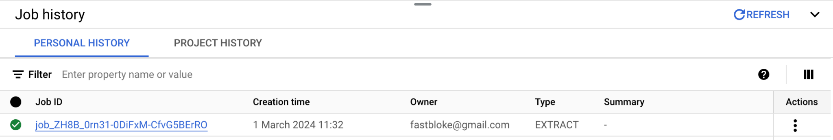
When you click the “x” to close it, notice the “Job History” tab with “Refresh” on the right hand side with an up arrow:
![]()
![]()
Click the “up arrow” and you’ll see your EXTRACT job logged:
Where did the data go? Go and check the csv file in the engagedusers Cloud Storage bucket:
Ooh! Our little file got so big! Did the Cloud Function do the upload? Go to the Firestore page using your pinned link in the top left burger menu:
Click on the (default) database:
And here’s our collection, each document using the clientId value as the key.
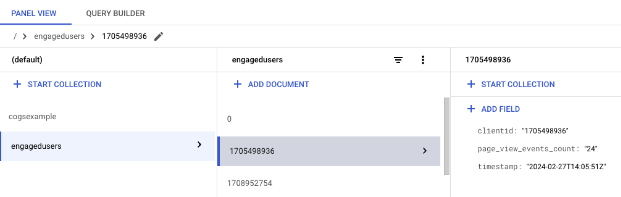
We have data in Firestore! We’re ready to close the loop and activate the data in our GA4 data collection.
#4. Server-side Google Tag Manager
We’ll use server-side Google Tag Manager (sGTM) to resolve the ID of engaged users and set or unset a user property to flag engaged users in GA4. sGTM has the ability to query Firestore privately in our Google Cloud Project without exposing any potentially sensitive data to the public – this is very powerful for data enhancement. If you haven’t set up sGTM yet, here’s an excellent guide to help you through the setup.
The steps to use the Firestore data are as follows:
- Extract the _ga cookie value
- Parse the cookie value using a custom template
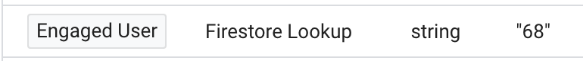
- Query Firestore using the parsed value in a Firestore Lookup Table
- Translate the Firestore lookup into data we can use the value in tags
#4.1 clientid variable
As the Firestore documents are keyed off the clientId, the last part of the _ga cookie value, we’ll need to access that cookie value in a variable. We can see the _ga cookie using dev tools, looking at Cookies in the Application tab:
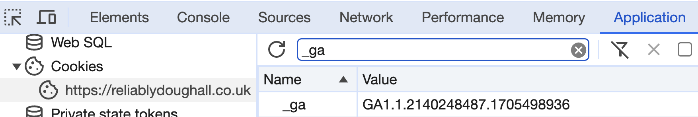
In Server Side GTM (sGTM), we can create a user-defined variable to access this first-party cookie. In the Variables section, click “New” under User-Defined Variables:


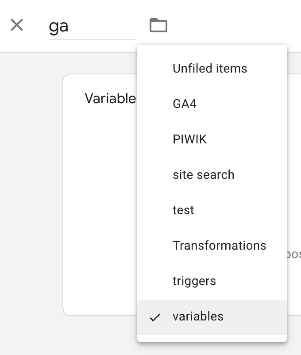
We give it a name and put it in the right folder:
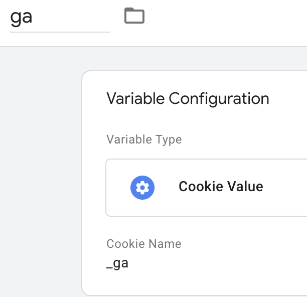
Then we choose the variable type by clicking on the Variable Configuration:
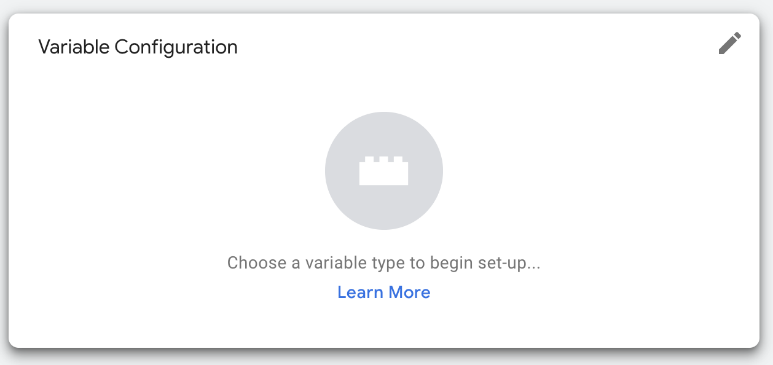
The Cookie Value variable type is a built in type under the Request collection of variables:

Then we tell the variable which cookie we’re interested in – don’t forget the underscore in the cookie name:
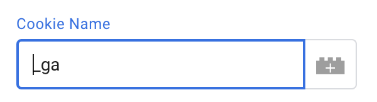
And there’s our completed variable, now click “Save”:
When running sGTM in preview mode, we can see the variable correctly populates with the value of the cookie:

#4.2 Custom Template Variable number 1
We’re only interested in the last part of the _ga cookie value, though, and that needs a custom template to split out the value. Setting up a custom template starts in the Templates section of sGTM:

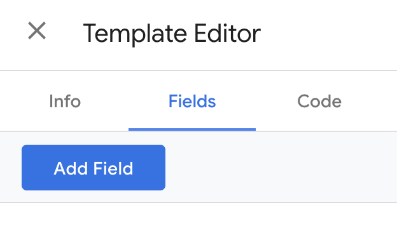
At the bottom of the Template page, we can click “New” to create a new Variable Template:

In the Template Editor, we’ll give our template a name first:
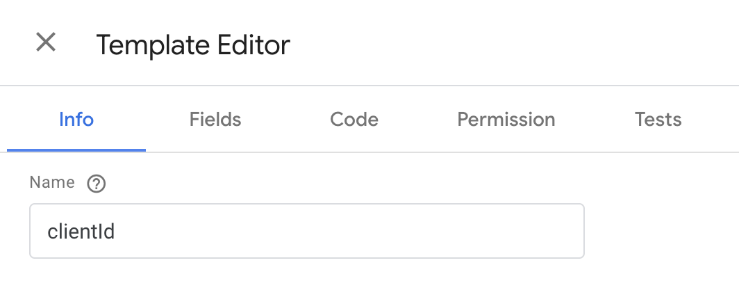
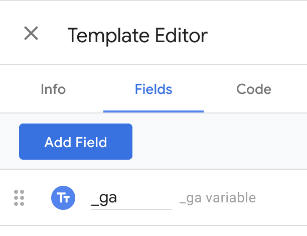
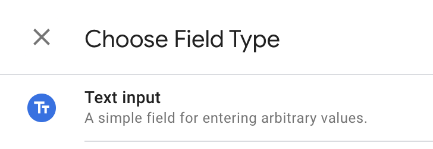
Next, we’ll go into the Fields section, as we want to be able to pass in the “ga” variable for processing. Clicking “Add Field”, we choose “Text input” from the right-hand side popup:


Then replace “text1” with _ga:
Click the down arrow on the right-hand side:

And we’ll give the field a label:
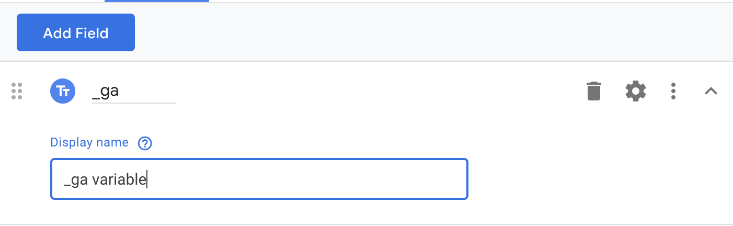
That’s the only field we need. Now we’ll put the code in, so click the Code tab:
The Code tab contains the bare-bones template code:
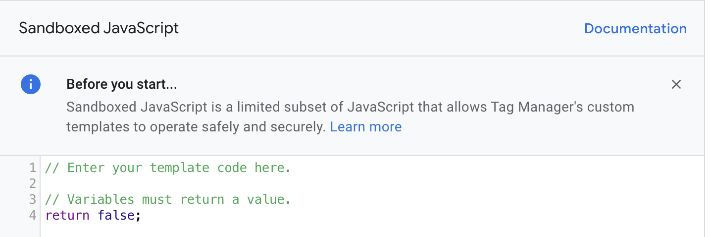
Use this gist to copy the actual code we want to use and paste it in place of the template code
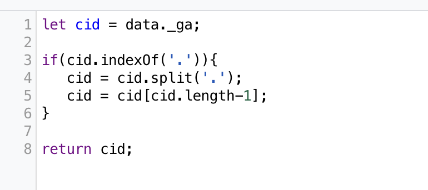
The value of the ga variable is accessed using data._ga – data followed by a dot and the name of the field we specified. We can do some basic string manipulation and then return just the last part of the _ga cookie, which is what we’re interested in.
We can now hit “Save” on our template (top right), then click the ‘X’ in the top left, and head back to the Variables section:

Click “New” under User-Defined Variables:

Then choose the variable type:
We now have a “clientid” variable type under Custom Templates:
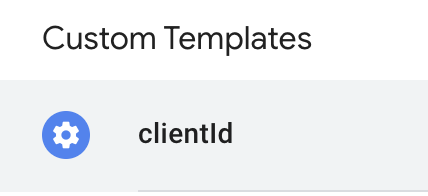
Choosing this type, we then have to fill in the _ga variable value using {{ga}}, our original Cookie variable:
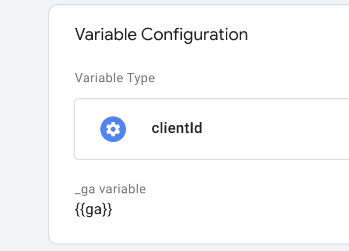
Now when we spin up preview mode, we can see our clientid variable giving the output as required to reference the right page in our Firestore collection:
![]()
![]()
#4.2.1 Firestore Lookup Variable
To query the Firestore collection, we can use the Firestore Lookup variable, so head back to the Variables section:
Click “New” under User-Defined Variables:
Then choose the variable type:
Under Utilities, find the Firestore Lookup:

Of course, as diligent GTM citizens, the first thing we’ll do is to name and folder the variable:
Then we get to choose how to query our collection. There are a couple of different ways to query our engagedusers collection. The most basic method is the one we’ll use – always choose the simplest method, you’ll thank yourself later! We’ll use the “Document path”:
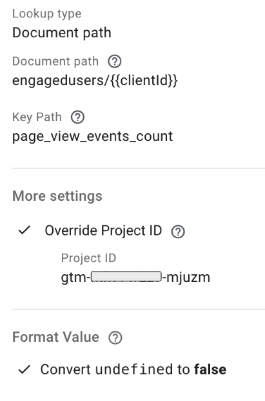
We know each document is unique because we used the clientid as the “key”. Using the output from our custom template variable allows us to fashion the query in the format:
collection/document
or engagedusers/{{clientid}} in our case.
Two important extra things to notice:
1: Make sure you have the Override Project ID field set to the project where your Firestore database resides – it might be different to your sGTM project.
2: We’ve decided to use the “Convert undefined to false” option in the Format Value section. “Undefined” is an unfriendly value – it literally means “dunno”! It’s a shrug of the shoulders. When engineering software we must use more definite and declarative values so if the user’s clientid can’t be found in the collection, they’re not an engaged user so we’ll use ‘false’ as the appropriate value. Much better to process in logic than ‘undefined’.
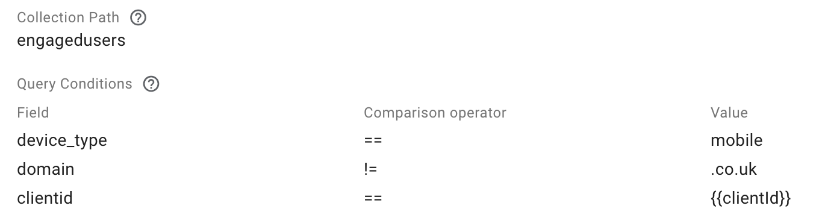
What if we wanted to be more specific or sophisticated with our query? We can match documents by the value in fields to make sure we extract the right record. Using the Collection path & query method enables us to build more powerful Firestore queries. In this example, if we had device_type and domain fields in our Firestore document, we might choose to determine if the user in question is engaged on mobile on non-UK sites like so:
Not needing this level of complexity, using the most basic method to query Firestore, we save the variable (Save, top right).
#4.3 Custom Template Variable number 2
At this point we could use the Firestore Lookup Variable output in a GA4 tag but this will be problematic downstream. The output from Firestore is the number of page_view events for a given user or false. Using this data ‘as is’ may cause cardinality issues in reports as advised by this GA4 message:
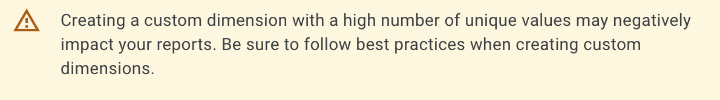
Why not just record the engagement level as a boolean – TRUE or FALSE? We’d quickly find this
level of granularity a hindrance. We will need to define different levels of engagement over time, by channel, by device, content category, demographic, and so on. Using another Custom Template Variable gives us control of the definition of engagement with the least complication.
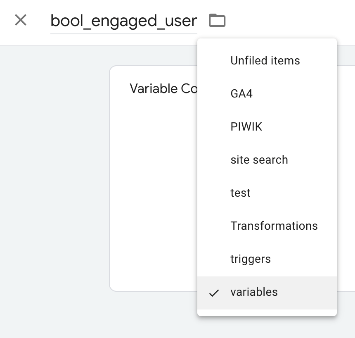
First, in our sGTM container, go to the Templates section:
![]()
![]()
Choose “New” in the Variable Templates section:

Inside the Template Editor, name the new template:
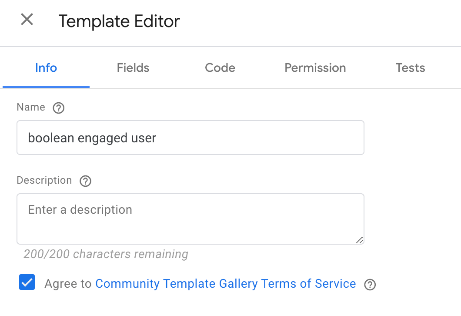
This variable will return a boolean (TRUE or FALSE) value based on the criteria we specify regarding the Firestore output. We need an input field to accept the Firestore output – In the Fields tab, click ‘Add Field’, amd choose a Text Input:
As we did for the last Custom Template, give the field a name to reference it in the code and a label for the user to understand the purpose:
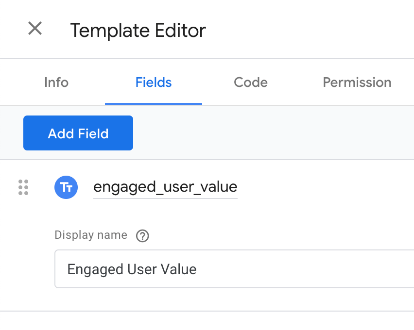
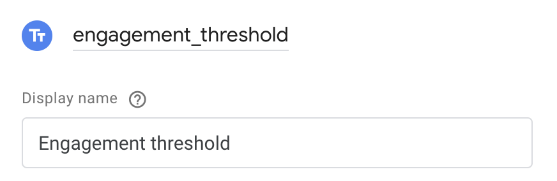
This variable template will use two fields. The second is the desired level of engagement:
Now the code – copy the 6 lines from this gist, and paste into the Template Editor code section like so:
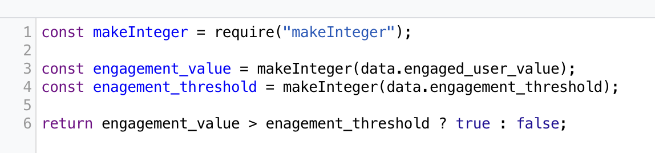
First, we take the Firestore output (data.engaged_user_value), and data.engagement_threshold and we make them into numbers – never assume the input is sanitised – make sure the type is correct. Then we can compare the values using a neat notation called the ternary operator. The value that the variable returns is dependent on the engagement_value being higher than the engagement_threshold. If it is, return true, if not, return false.
Now, we have a template we can reuse for different thresholds of engagement, and we won’t run into cardinality issues with Google Analytics.
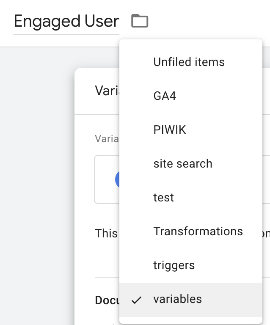
#4.3.1 Engaged User Variable
Again, we’ll head to the variables section to create a variable using our new template
![]()
![]()
Click “New” under User-Defined Variables:
Name and folder:
Then choose the variable type:
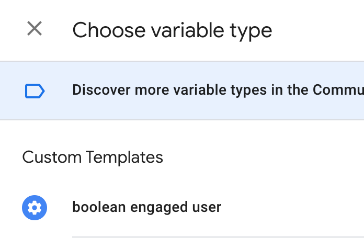
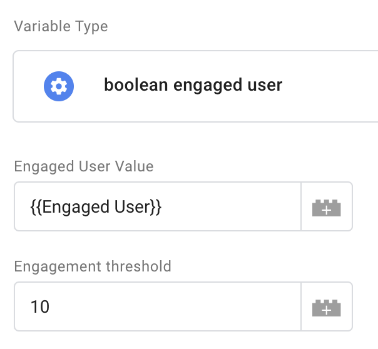
The first field is the input for the output from Firestore, the second, we get to decide. In this variable, we want more than 10 pageviews. We could change this in other variables depending on where and why we want to use the data:
Hit “Save” (top right), and we’re ready to use the data in a tag.
#4.4 GA4 Data
Head to the Tags section to use the variable in our GA4 data:

You might already have a GA4 tag, but we’ll start from scratch in case this is new to you (There’s a great course here if it is new). In the Tags section, click “New” in the top right:

You know the GTM drill, name, and folder of the new asset:
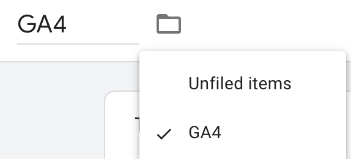
In the tag config (click), we’ll choose the GA4 tag:
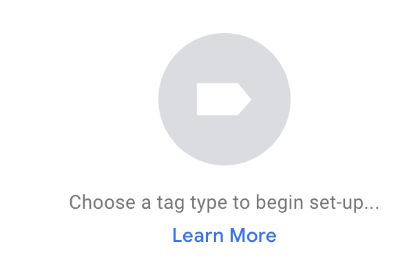
Here’s our bare-bones GA4 tag:
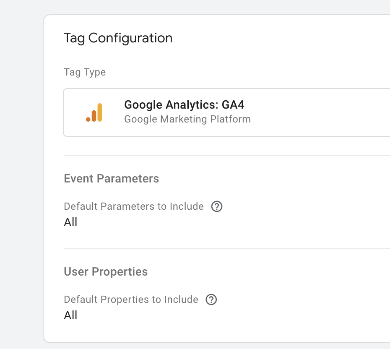
At the very least, add your measurement ID in the appropriate field. The next port of call is the User Properties section. Let’s click and expand that section:
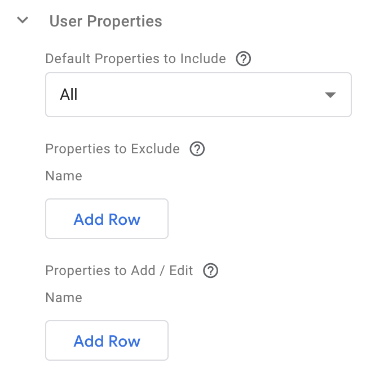
We want to use our {{Engaged User}} Firestore Lookup variable as a User Property so we can flag engaged users in reports for segmentation, and audience building. So, we need to click “Add Row” under the “Properties to Add / Edit” section:
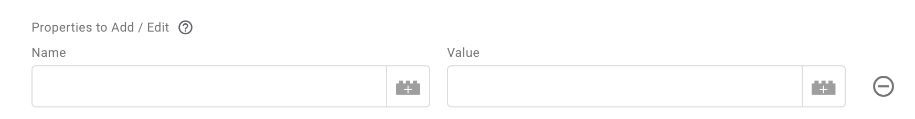
Let’s fill in the blanks like so:
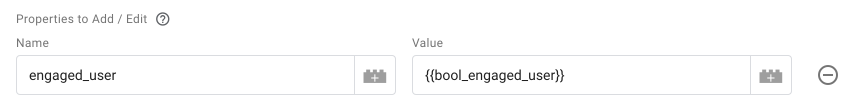
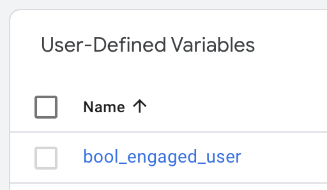
The property name follows the snake_case GA4 convention, and the value is supplied by our recently created bool_engaged_user variable.
Click into the Triggering section to configure the trigger for the GA4 tag.
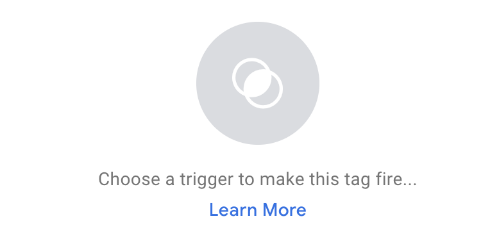
If you don’t already have such a thing, follow the instructions in the Analytics Mania guide to setup a GA4 trigger. Then save the tag and we’ll go and test it.
#4.4.1 Testing
Follow the excellent instructions in this guide to enable Preview mode on both your client side and server side containers.
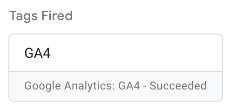
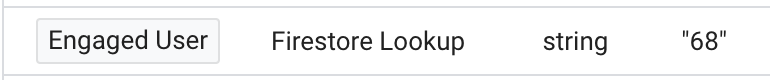
When I test a page on my site, I check the server side Preview mode page. Looking at the page_view event, I can see my GA4 tag fired:
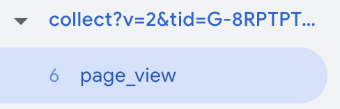
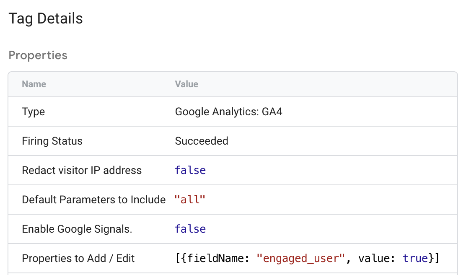
So I click into the tag, and under the Properties to Add / Edit in the Tag Details, I can see my value is populated:
I check in the Variables section and I see the bool_engaged_user variable sporting the same value:
![]()
![]()
And that’s because the Firestore Lookup returned a value that’s higher than the threshold I put in the variable
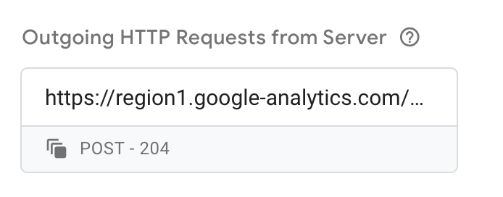
I can go into more detail to see the request that was sent from my sGTM container to Google analytics by clicking on the Outgoing HTTP Requests from Server section:
In the Request URL section, I see this (note: this might be in the Request Body section):
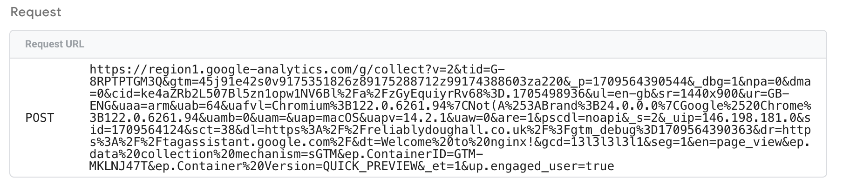
The important part is:
![]()
![]()
Right, that’s the data being sent, but can we confirm it’s being received and processed by Google Analytics? Yes, in the your GA4 reporting UI, click the Admin button in the bottom left:

Find the DebugView under the Data display section:

Because we have our client-side GTM in Preview Mode, our hits will appear in the DebugView so we can inspect the values:
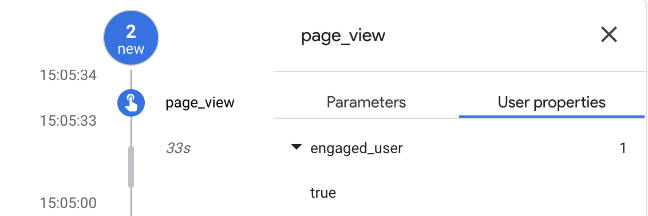
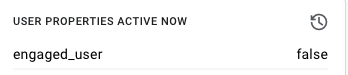
Check the User Properties Active Now in the bottom right hand corner:
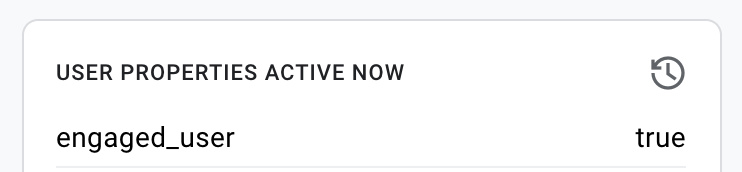
That’s all looking good and correct. That confirms the right value is being sent as the right user parameter.
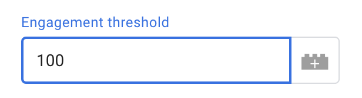
I will modify the engagement threshold value by changing it to 100. I go back into the sGTM container and go to the Variables section:
![]()
![]()
I click to edit the bool_engaged_user variable under the User Defined Variables section:
I click on the Engagement threshold and change it to the new value – 100:
Now I click save and refresh the server-side preview by hitting the “Preview button” again

Repeating my pageview test, the Firestore value remains the same. Good – I’ve not refreshed the table from BQ yet – this value will only change once I repeat the query, export, and upload process.
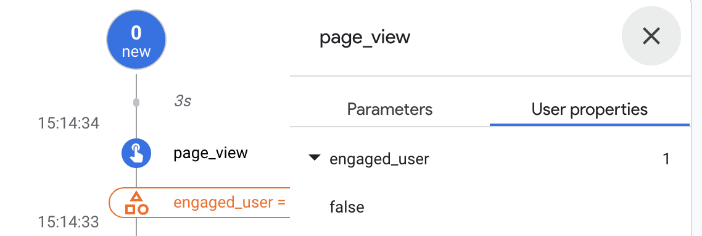
The engaged_user field is now false, though:
![]()
![]()
I check the tags section, and the GA4 tag succeeded, while checking the outgoing requests as I did before, I see that the engaged_user value is now false:
![]()
![]()
And so, back to the Google Analytics reporting UI DebugView, I confirm the correct value of false has been received and processed:
See how easy it is to experiment or update engagement thresholds without changing any code? Only a redeployment of the sGTM container is needed.
#5. Reporting
Once the data has been ingested in GA4, then what? How do we use it beyond seeing the value in the DebugView?
#5.1 Realtime
We can see our user property appearing in the Realtime overview:
#5.2 Custom dimension
A clear use case is in segmenting reports in GA4. Head to the Admin section again:

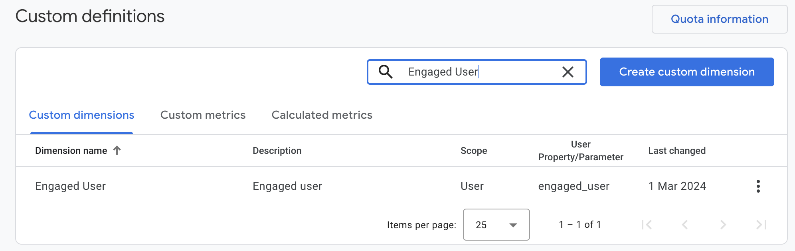
Then, find the Custom definitions section:

Create a new custom dimension:

Name it appropriately:
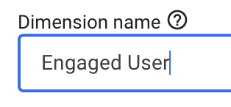
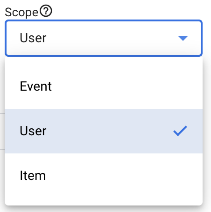
This is critical. Change the scope of the dimension from Event (default), to User as shown below:
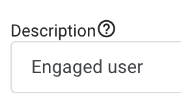
Add the description:
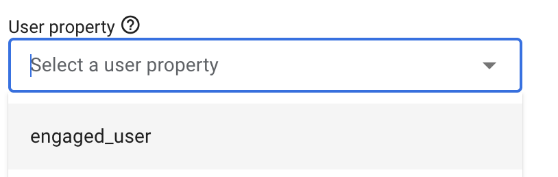
Then, choose the property that was sent to Google Analytics for this very purpose. You might need to wait for the data to be processed – up to 24 hours – before the value is present in this section to be used:
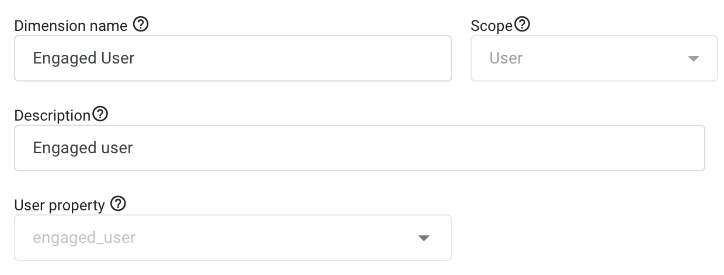
The completed Custom definition:
To learn more about custom dimensions, read this guide.
#5.3 Report filter
We can now filter reports using this new dimension. For example, filtering the Events report to show engaged user event counts, I choose “Add filter” from underneath the report name:
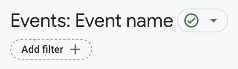
Then select the dimension just created and the required value:
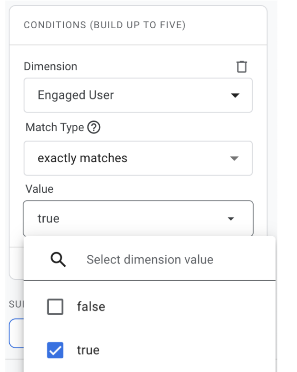
Remember, you might have multiple different values from each variable – tune the filter to build the audience you need for your use case. You probably won’t fall foul of the cardinality trap – that takes thousands of values.
With your new custom dimension superpowers, this article on report customisation will be extremely useful.
#5.4 Explore
If “Explore” is new to you in GA4, refer to this essential guide before diving into this section. Explore is a super powerful reporting interface that offers more control but also requires a little more skill with GA4 data.
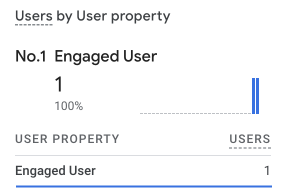
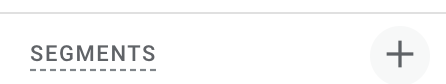
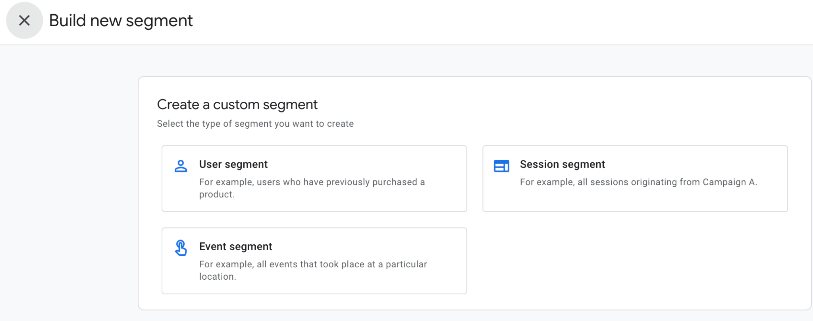
Let’s use Explore to take a look at our enriched data using segments. Create a new segment by clicking the “+” icon In the “Segments” section:
As the Engaged User custom dimension is user-scoped, we need to create a user segment:
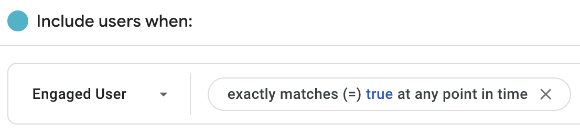
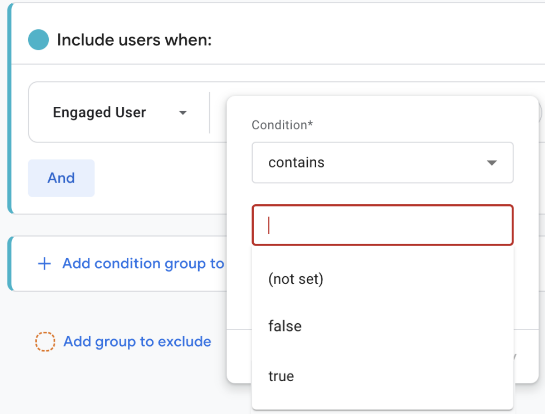
The segment logic condition can include events or dimensions, but we’re only interested in the Engaged User dimension, so we’ll search for it and select it:
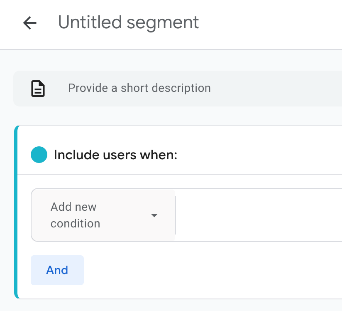
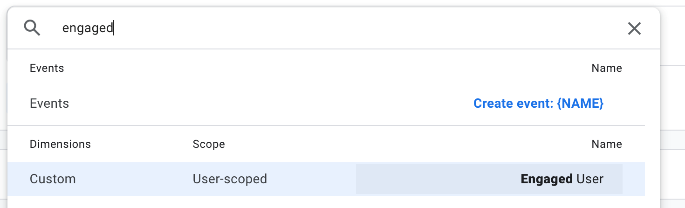
Creating the segment is then really simple:
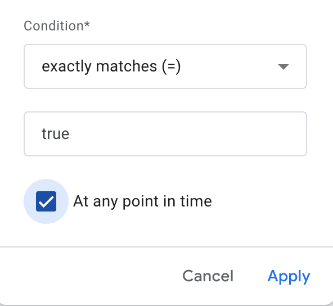
The interesting choice here is the “At any point in time” clause. Ask the data who is engaged now by unchecking it – who’s ever been engaged by checking it – sounds like two useful segments for comparison to me…so here’s our basic Engaged User segment:
Notice in the top right of the segment editor you can build an audience from this segment:
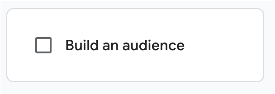
This is one of the most powerful tools in your kitbag now. Exclude engaged users from acquisition campaigns. Measure engaged users audience volumes. Target key audiences with retention campaigns and new content drops – essential marketing.
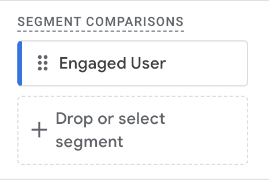
Applying the segment to a Funnel Exploration is a typical analytical technique. Dragging and dropping our segment into the Segment Comparisons section in the Settings tab is straightforward:
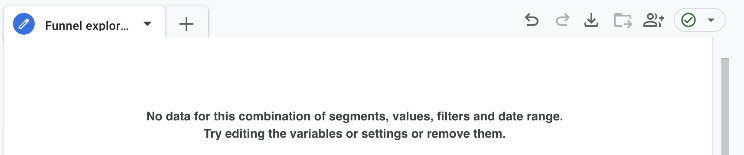
You might encounter this situation when applying segments:
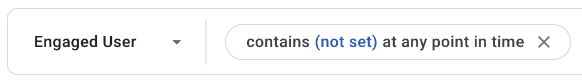
When creating the Engaged User segment, you may notice (not set) values to choose from:
You can use this to create a new segment called “No Engagement data”:
and compare this to a segment of New Users:
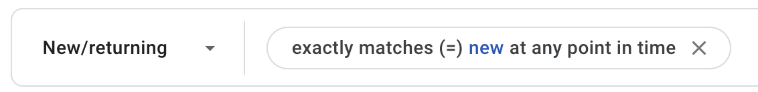
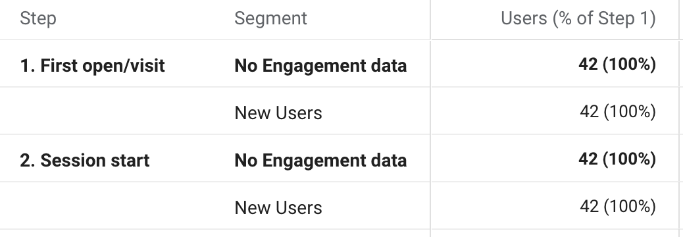
This is an extreme illustration of new users dominating the data set – a flood of new users haven’t been included in the data query export/import. You might run a manual refresh on the data or revisit the report when the automatic update has refreshed the data.
Further analysis of the Explore reports with different segments and dimensions is encouraged, as this will inform what other enriched segments are worth exploring.
Conclusion
Apart from the advantages mentioned in the opening paragraphs, fewer tags, fewer cookies, and lighter pages, why have we done this? Is there more value to be had from this long article? It feels like there’s more work going on for more-or-less the same result but actually there’s more to it than it seems at first.
This demonstration shows how we can leverage existing data without extra tagging. We can improve data quality through automation and finding a better fit for the data to solve a specific business opportunity.
We’ve enhanced our first-party data easily and safely. With 3P data in decline, this technique will have increased utility as time goes on.
For publishers, understanding changes in engagement is crucial. What content works? Does a new strategy resonate? Furthermore, being able to define exactly what engagement means to you, by device, by region, this data is rocket fuel for recommendation algorithms, for machine learning, and audience creation.
We’ve enhanced our 1P data specifically about engaged users. The same process can be applied to multiple data points at the same time. Think beyond just engagement – who’s regularly using promotions? Which users buy regularly? Use the same technique to integrate CDP lifetime value data with your audiences.
Enriching data using Server-side Google Tag Manager and the Firestore lookup is a versatile and powerful architecture. Combining different first party data sets in a privacy preserving context allows amplifying the returns invested in the data.
With that said, be mindful of costs. Storing and querying data in BigQuery will incur charges – hence, consider a weekly query cadence. Each incoming GA4 request will perform a Firestore lookup – take note of the free tier and where you might see extra charges.
Technically, this isn’t the most elegant implementation, for sure. Some will rightly say it takes the scenic route somewhat and can be optimized. Yes, and good – go for it! Don’t treat anything in this article as production-ready.
This is intended as a thought provocation – something to show “the art of the possible”, but please, go and do it better than this in production. Good news, that’s not hard at all. Overall, there’s very little code creation required, the integrations are very much off-the-shelf, and we give thanks again that GA4 exports data into BigQuery even for the free tier.

0 COMMENTS