March 27, 2025
Key event rate in Google Analytics 4
Google Analytics has a weird relationship with conversions. In older versions, they were called goals. Then, they were renamed to conversions in GA4 (which is an industry-known term). But later, they renamed them to key events.
So, if you were looking for something like “Google Analytics 4 conversion rate”, the correct term now is “Google Analytics 4 key event rate”.
I agree that this might sound confusing, especially for newcomers. But it’s something you will have to get used to. Let’s take a closer look at this.
Table of contents
– Hide table of contents –
- Key events? Conversions? What’s going on?
- What is a key event?
- What is the key event rate?
- Two types of key event rates in Google Analytics 4
- Standard GA4 reports
- Building an exploration with key event rate
- Ecommerce conversion rate
- Final words
Key events? Conversions? What is going on?
At some point, Google Analytics 4 has renamed the “Conversion” concept to “Key event”. So, what is the difference? Nothing really!
Just like the previous Conversions, Key events are important actions that you want to use to measure the success of your business. According to Google, this change will “simplify conversion measurement and reporting across Google platforms”.
Not to make things confusing, but conversions still exist in Google’s world, specifically within Google Ads. Conversions are the metric in Google Ads used to track what happens after a user interacts with your ads; key events – when shared with Google Ads – are considered conversions, so conversions measure the success of your ad campaigns.
So, long story short, Conversions in GA4 are now Key events, but conversions are still a metric in Google Ads. Make sense?
What is a conversion/key event in general?
Not to make things confusing, but conversions – by definition – are still relevant to analytics, and it’s important to understand what the term means, given that some of the readers landing on this page may be completely new to web analytics and the concept of conversions.
If you already know what conversions are – and that when we say conversion, it’s just the definition of what Key events measure – feel free to skip to the next chapter of this blog post.
While GA4 now uses the metric “Key events”, it still measures visitors completing an important action. So, in the general sense, what is a conversion?
A conversion/key event is a crucial interaction you want your visitors/users to complete. Conversions can be split into micro and macro conversions. An example of a micro-conversion can be a newsletter subscription, a download of a whitepaper, etc.
Micro conversions are actions that put your visitors/users one step closer to the main (macro) conversion. Macro conversions are more significant interactions, such as a purchase.
To keep us on our toes, the Key events metric in Google Analytics 4 measures these actions.
By tracking key events in GA4 (for now on, we will only be using the term “key event”), you can better understand what does and doesn’t work for your business. For example, you can create a segment of your users who have made a purchase and then try to understand their behavior, etc.
Also, when shared with Google Ads, key events are used to measure the effectiveness of advertising campaigns through conversions (okay, I lied, this is the last time we use the term “conversions”) and then redistribute your advertising budget.
You can learn more about conversions (and how to configure them) here.
What is the key event rate?
In previous Google Analytics versions, the conversion rate was calculated like this:
Sessions with key events divided by all sessions.

That way, you can know the percentage of how many sessions had a key event.
But in GA4, there is a welcome upgrade. I will explain that in a moment.
Two types of key event rates in Google Analytics 4
In GA4, there are now two ways to measure key event rate:
- Session key event rate. This is the same as we had in the previous GA versions.
- User key event rate, where we divide users (who converted at least once) by all users
So, if you have been wondering how to check the key event rate in GA4, let me show you. But first, let’s look at the differences between session and user key event rates.

Session key event rate
The session key event rate is calculated by dividing the number of sessions with a key event by the total number of sessions.
To understand this concept better, let me give you an example.
Let’s say that we have a user who first came to your website from a Google search, and the next time, he/she came from an email newsletter. Traffic sources don’t matter much in this case. In that second session, the user converted. When I say “Converted”, I mean “a user triggered a key event”.
In total, we have two sessions, and one of them had a key event.

That’s a 50% session key event rate.
Then we have a second user who landed on your website from a paid ad (google / cpc) and converted. Then, in the next session, the user was also converted. In this case, we have two sessions in total and two sessions with key events.

That’s a 100% session key event rate (because 2 out of 2 sessions had a key event).
In total, we had 4 sessions, and 3 of them contained key events.
3 / 4 x 100% = $75% session key event rate.
But this logic has one flaw.
What if your goal is to convert the visitor/user once? All subsequent sessions/key events don’t matter to you (but every additional visit still continues to reduce your session key event rate).
That’s where the user key event rate becomes very useful.
User key event rate
User key event rate is all about users. If a user converts, the user key event rate increases. But if, after that, the user keeps coming to your website, the rate stays the same (because the user has already converted in the past).
The user key event rate is calculated by dividing the number of users who triggered any key event by the total number of users.

Let me explain this metric with a visual example.
A visitor comes to our website from a Google search (google / organic) and then comes back from an email newsletter the next day. None of those sessions had a key event. Thus, the user key event rate is 0% because one user and zero users converted.
0 / 1 x 100% = 0%.

A second visitor comes to our website and converts on the first session. Then in the next session, the visitor converts again.
We have 1 user, and that 1 user converted at least once.
1 / 1 x 100% = 100%

If we sum up the sessions of both users, we get 2 users in total and one user who had at least one key event. 1 / 2 x 100% = 50%.
If the 2nd visitor comes back to our site once more (but does not complete a key event), the user key event rate will still be 100% for that user (because that user has already converted in the past).
Key event rate in standard GA4 reports
It’s time to build a GA4 key event rate report. Let’s start with standard reports. If you don’t see it in the standard reports (such as Traffic Acquisition), you can easily customize them.
Go to Reports > Acquisition > Traffic acquisition and click the Pencil icon in the top-right corner.

Then click on Metrics and keep looking for the Session key event rate.

Click Add metric.

And keep looking for Session key event rate. Click it and then hit Apply.
Finally, hit Save > Save changes to current report > Save. And that’s it! Now you have the session key event rate in your traffic acquisition reports (that are session-scoped).

You can even select in the dropdown whether you want to view the rate of all key events or just a particular event.
The same customization process applies to the User key event rate.
Build an exploration with key event rates
Let’s use key event rate in custom GA4 reports, a.k.a. Explorations. Let’s start with the sessions.
Session key event rate
On the left sidebar, go to Explore and click Blank.

Let’s build a report of session source/medium and session key event rates.
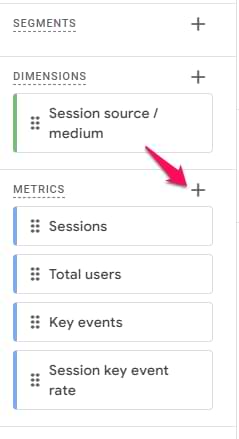
In the Variables column of your Free form exploration, click a plus in the Dimensions section.

Select Session source / medium and hit Import.

Important: don’t use the regular “Source/medium” dimension. If you want to see data of your *sessions*, you must use a dimension that contains *session* in its title.
Now, click the Plus next to the Metrics and select metrics you want to include in the report, for example, Sessions, Total users, Key events, Session key event rate. Click Import.
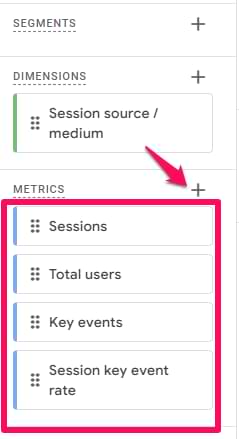
Then, double-click the Session source / medium dimension and all metrics. That way, they will be added to the report.
And that’s it! You now see the list of your top-performing sources, mediums, and their key event rates.
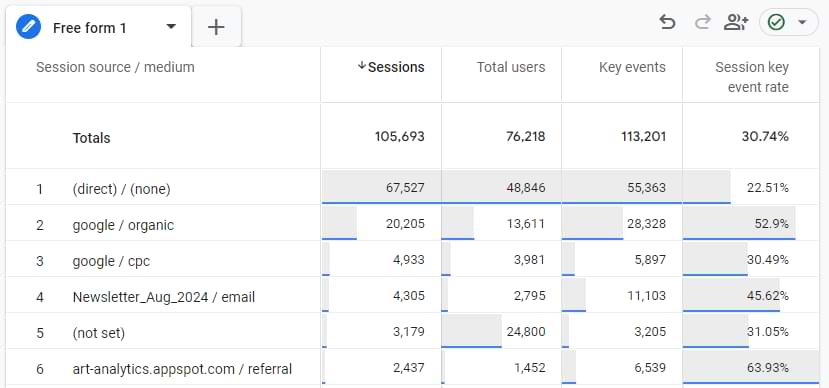
Note. You probably remember the formula for the Session key event rate: sessions with key events divided by all sessions. But if you divide the number of key events by the number of all sessions (that you see in the report), the result will not match the session key event rate. Why?
It’s because the key events column includes *all* key events. Even if 1 session had 5 key events, all 5 key events would be included in the Key events column. But only 1 session, in this case, will be used by the Session key event rate metric.
User key event rate
Let’s add one more metric. Click the Plus icon in the Metrics section:
And import User key event rate. Add it to the report.

An additional column will appear, and you will notice that this metric is higher compared to the session key event rate.
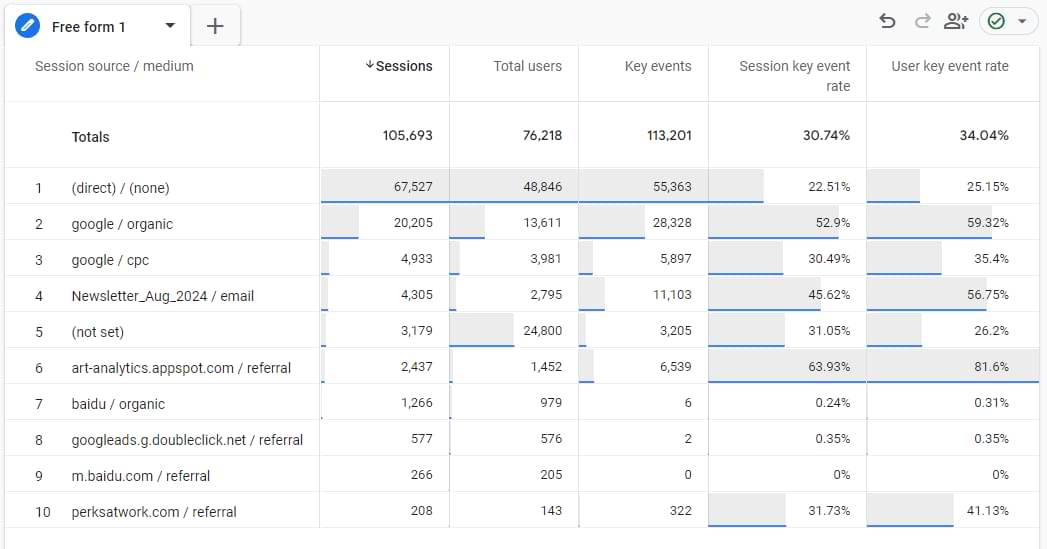
That’s because the User key event rate checks the number of users who converted. If the same person has converted at least one, it will be included in the calculation. Sessions without key events of that user are not taken into account.
How to recreate an e-commerce conversion rate?
In the older version of Google Analytics, there was a metric called Ecommerce conversion rate. If we rephrase it in the context of GA4, it’s the Session key event rate that looks only at website purchases.
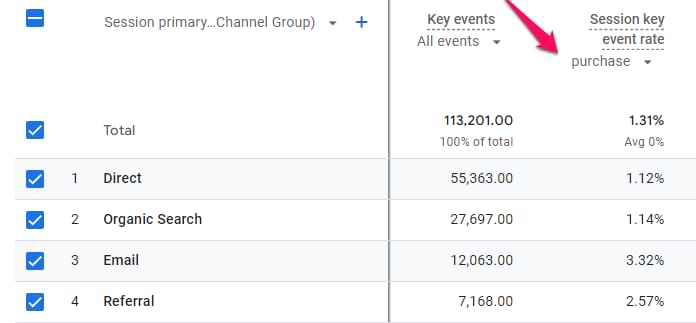
In standard GA4 reports, it’s easy to check. Go to the Traffic Acquisition report, and customize it to include the Session key event rate metric (like I did in this chapter). And then select purchase event in that report.
And that’s it. You are now looking at the e-commerce key event rate within the standard report.
But what about explorations? Things get a little trickier, but still possible.
Go to Explore > Blank.
And then add the following:
Dimensions:
- Event name
- Session source / medium
Metrics: Session key event rate. Of course, you can add more metrics if you wish. For example, sessions, total users, ecommerce purchases, ecommerce revenue, etc.
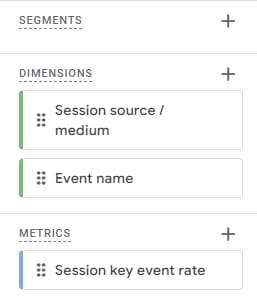
Double-click Session source/medium and Session key event rate so that they will be added to the report.
But the problem with this report is that it now includes *all* key events in the calculation. You need to narrow down just to purchases. That’s why we will create a filter: Event name matches regex session_start|purchase. Click Apply.

It’s important that we also include session_start here. This kind of filter will include all sessions (in the key event rate calculation) but will use only purchase event as the key event .
If you also include the Sessions metric in the report, it will look like this:
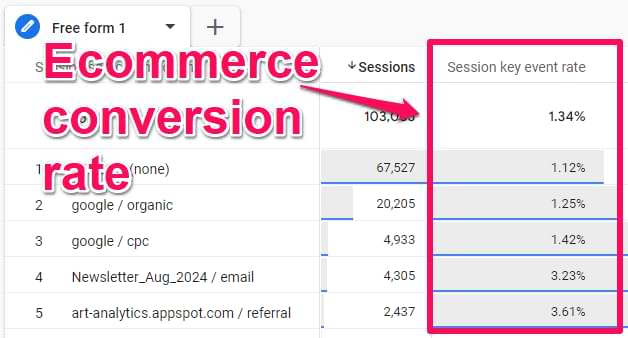
And there you have it. In the example above, the total session key event rate is 1.34%.
Key event rate in Google Analytics 4: Final words
Key event rates allow us to quickly evaluate the performance of marketing campaigns, channels, mediums, etc. The higher the percentage, the better.
If you are getting a lot of traffic from a particular traffic source, but your key event metrics are much lower than average, this might indicate an ineffective marketing channel. Unfortunately, giving universal advice on what should be fixed is impossible.
But with this metric, at least you know that *something* is wrong with that traffic source, and a company must do something.
If you want to learn how to analyze key event data and get insights, look at my Google Analytics 4 course, where I focus a lot on that.
Also, I appreciate the addition of the user key event rate because working just with the session metric is not enough.
0 COMMENTS