
May 5, 2025
Tracking Errors with Google Tag Manager: 5 Things to Measure
Updated: May 5th, 2025
You can do many cool things with Google Tag Manager, like track purchases, form submissions, link clicks, etc. All of these are positive actions for the business. But what about negative ones? Errors should also be tracked, as they might provide you with some hidden gems.
Identifying where your visitors/customers are struggling and fixing those issues can quickly improve conversions on your website.
So, what kind of errors can you track with GTM? In this guide, we’ll look at five different groups of errors that you can track with Google Tag Manager.
Here’s what you will learn in this article
- #1. Track JavaScript Errors with Google Tag Manager
- #2. Track 404 Errors with Google Tag Manager
- #3. Checkout Errors
- #4. Form Errors (e.g. Registration and Login forms)
- #5. Server Error (like 50x, etc.)
- Several Tips Regarding Error Naming Convention
- Example of a setup + Reports in Google Analytics 4
- Final words
Errors are listed in no particular order; therefore, don’t think that error #5 is less valuable than #1.
Also, in this article, I presume that you have already installed Google Analytics 4 with Google Tag Manager. If not, then read this article first.

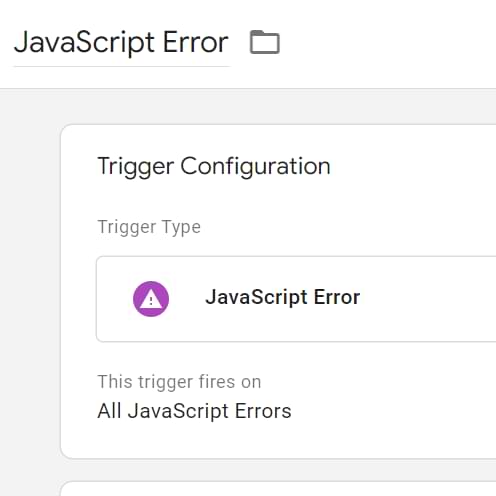
#1. Track JavaScript Errors with Google Tag Manager
GTM has a built-in trigger that captures uncaught JavaScript errors. If you look at the list of all possible trigger types in GTM, you can probably easily guess which trigger I’m talking about. Yes, it’s a JavaScript Error trigger.

#1.1. How to Configure JavaScript Error Trigger in Google Tag Manager
Uncaught means an error wasn’t captured and handled by some script on a page. In plain English: if an unexpected error occurs in JavaScript code and that code was not programmed to deal with it, the JavaScript Error trigger will track it.
However, you should not think this trigger catches ALL possible errors on a page. If a JS error occurs on a page and the script was programmed to handle it by showing a specific error/warning popup to a visitor, such an error will not be tracked by GTM.
Go to Triggers > New > Trigger Configuration > JavaScript Error to get started. Leave all the settings as they are and save the trigger.

Also, go to Variables > Configure (in the Built-in Variables section) and enable Error Message, Error URL, and Error Line.
When GTM captures an error, you can get 3 data points with it:
- Error message (the text of the JavaScript error message, for example, Uncaught ReferrerceError: testvariable is not defined)
- Error URL (the address of the page where the error occurred)
- Error Line (the line number in the code where the error was detected)
You could send all of those data points to Google Analytics. To do that, go to Tags > New > Google Analytics > Google Analytics: GA4 Event and enter the following settings (make sure that you have already enabled the Error Variables in the container):
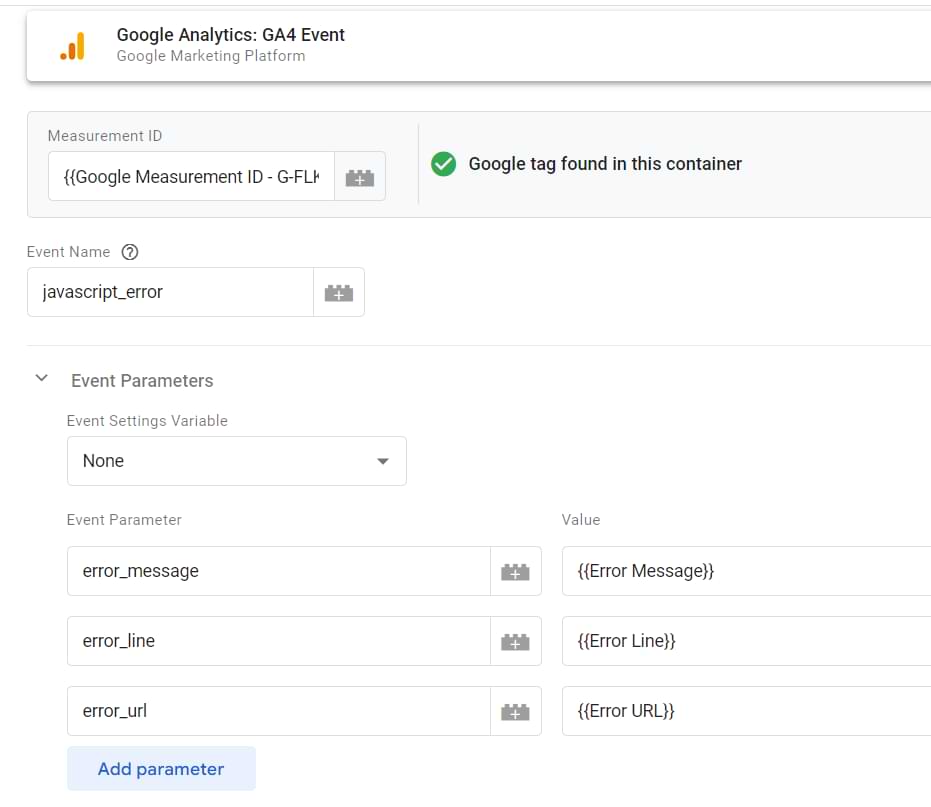
I entered the Measurement ID as a constant variable because I believe it’s a better practice than just copy-pasting the ID from tag to tag.
Finally, assign the JavaScript error trigger (that you have previously created) to this GA4 Event tag. Save the tag, refresh/enable the preview mode.
If you want to test this, you can add this code (temporarily!) to a page via the content management system:
<script>
  setTimeout(function(){
      jstestingvarwithalongname.push({'key' : 'value'});
  }, 2000);
</script>
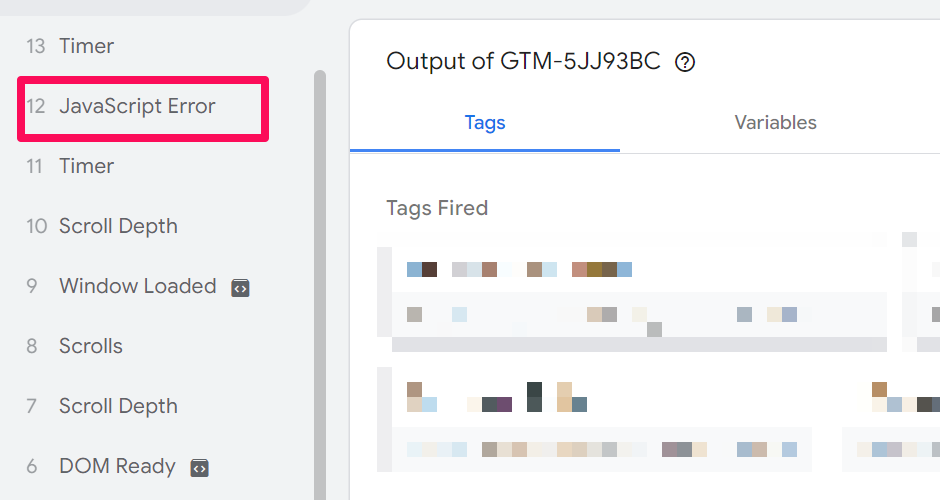
When you save the changes made and navigate back to the page to test (but before that, refresh or enable the GTM preview and debug mode), you should see the JavaScript error in the GTM debug console.
Remember, the aforementioned line of code intentionally contains a JS error. Remove it immediately after the test is done.
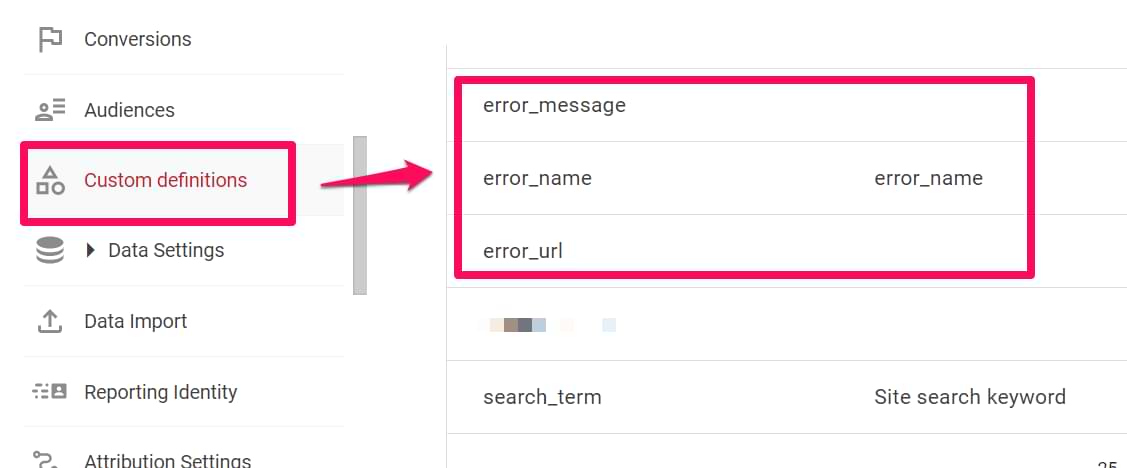
Now, if you want to see the variables passed along with the event (error_message, error_line, error_url) inside GA4 reports, you’ll need to register them as custom dimensions. I’ve written an extensive article on adding custom dimensions to GA4, which you can read by clicking here.

#1.2. Why is it useful?
If your developer is not tracking JavaScript errors with a dedicated tool (like TrackJS), JavaScript Error tracking with Google Tag Manager is better than nothing (of course, you should not think this is 100% accurate).
You can track JS errors as negative goals and then see the number of sessions that had at least one error (more on negative goals — later in the blog post).
Another idea: Sequence segments. For example, show all the sessions that entered the checkout and then had a JavaScript error but did not make a purchase.

This segment is more useful for those businesses where customers usually convert in the same session they arrive.
These are just several ideas, and everything depends on your imagination.
#2. Track 404 Errors with Google Tag Manager
Another type of error that you can track with Google Tag Manager is 404, a.k.a. Page Not Found. I have a separate blog post (covering other alternatives, too) for that, but here are some of the highlights + new ideas.
There are several different ways to tackle 404 error tracking. I’ll mention two:
- Using the Page Title dimension to identify the “Page not found” errors.
- Asking a developer to push the 404 events to the Data Layer
#2.1. Using Page Title
This method will be helpful if the page title of 404 pages contains “Page not found”, “Page missing”, or some other phrase that lets you quickly identify that a visitor has landed on a 404 page.
How can you check that? Open a website you’re working on, and add some gibberish at the end of the URL, e.g., https://www.youwebsite.com/posts/somenonsense
Are you redirected to a 404 page? What is the title of the page? (you can check that in the browser tab):
To learn all the technical details, read this blog post.
#2.2. Ask a developer to push the 404 error to the Data Layer
Here’s another option if the last one did not work for you. Ask your developer to activate the code below whenever a visitor lands on a page that contains a 404 (page not found) error
<script>
window.dataLayer = window.dataLayer || [];
window.dataLayer.push({
  'event': 'page_not_found',
});
</script>
P.S. You are free to use different values for those keys that match your own naming convention.
This code will push the error information to the Data Layer.
Once the developer implements the code, you will need to:
- Create a Custom Event Trigger
- Create a Data Layer Variable
- Create a Google Analytics Event tag that sends the 404 error to GA4 as an event
First, let’s start with a trigger. Go to Triggers > New > Custom Event Trigger and enter the following settings:
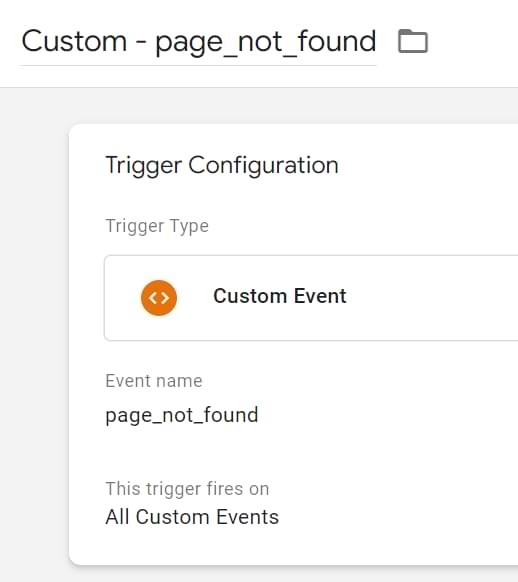
Enter the value of the “event” key in the “Event name” field. If you used my code example, enter “page_not_found” (without quotation marks).
Important: event names are case-sensitive in GTM.
Now, we move to create the GA4 tag. Go to Tags > New > Google Analytics > Google Analytics: GA4 Event and enter the following settings:
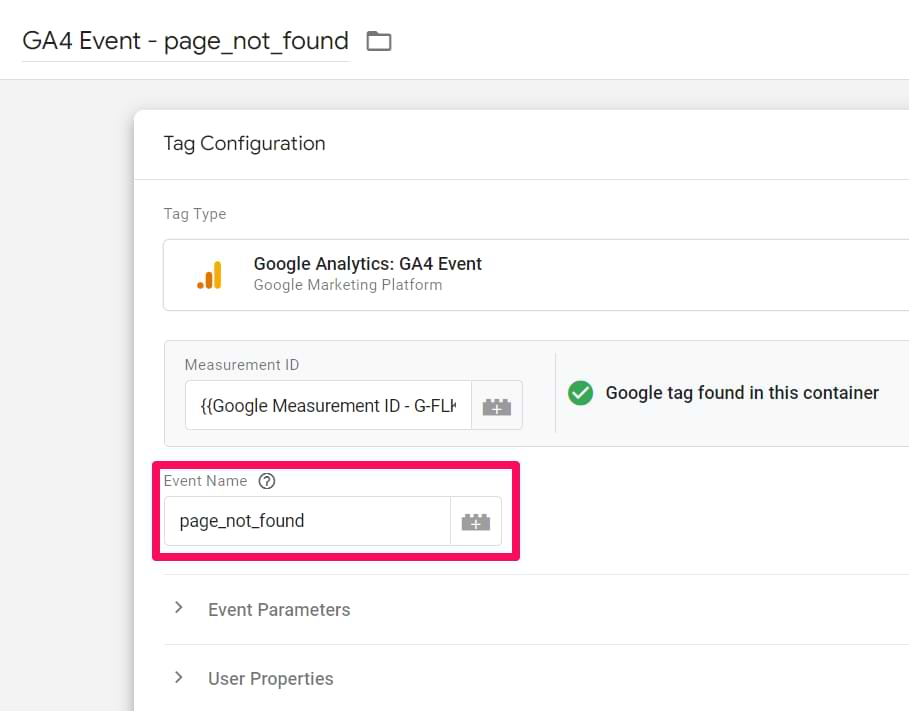
I entered the Measurement ID as a constant variable because I believe it’s a better practice than just copy-pasting the ID from tag to tag.
Don’t forget to test the setup with the GTM preview and debug mode + publish the changes after that.
#3. Checkout Errors
Checkout errors are the third group of errors you need to keep an eye on. I’d say these are among the most important because the visitor/user is very close to the conversion (e.g., purchase, signup, etc.).
Your goal is to reduce friction/struggle as much as possible.
What kind of errors should you track? Consult with a developer on what is possible.
Here are some ideas:
- Form-related errors (like “some required fields are not filled in: first name, address”)
- Form-field-related errors (like “invalid shipping address”)
- Payment-related errors (like “insufficient funds” or “card declined”) (just make sure things like credit card data are not tracked)
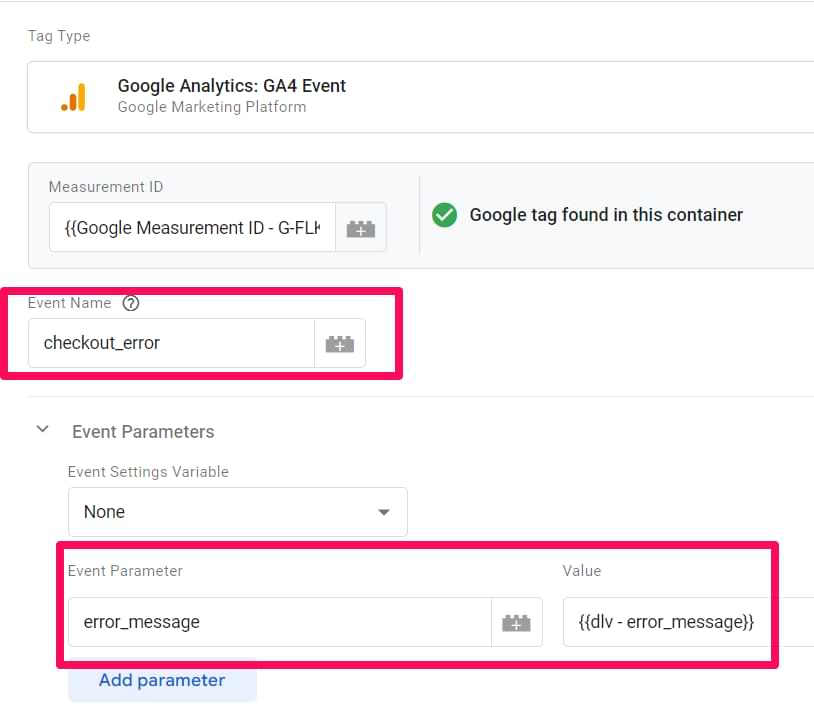
After identifying groups of errors that you want to track, ask a developer to push those errors to the Data Layer; here’s a sample code:
<script>
window.dataLayer = window.dataLayer || [];
window.dataLayer.push({
  'event': 'checkout_error',
  'error_message': 'card declined' // some descriptive message about the error
});
</script>
Then apply the same principle I’ve explained in chapter #2.2. of this blog post, create:
- Custom event trigger
- Data Layer variable (for error_message)
- Google Analytics tag
Here’s what the tag should look like (don’t forget to assign the Custom Event trigger to this tag).
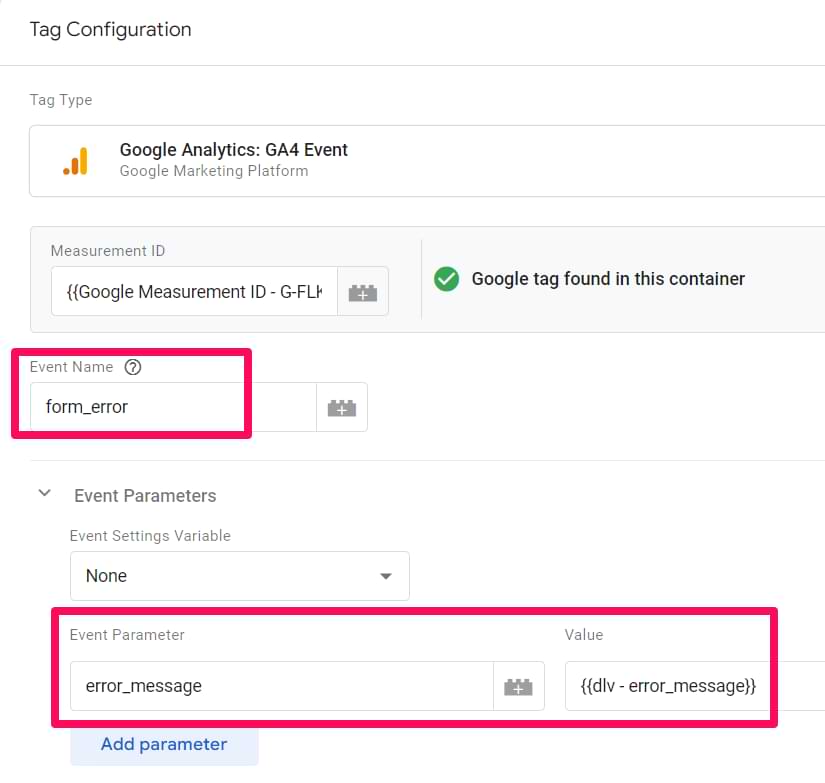
#4. Form Errors (e.g., Registration and Login forms)
There are different ways to track form errors. Some are more reliable, while others are not so much. Once again, the most robust way is to cooperate with a developer and ask them to push the error data to the Data Layer.
I will not explain this principle all over again. Please revisit chapter #2.2. of this blog post.
In addition to the “Developer + Data Layer” method, here are other alternatives. Remember, they might be more fragile and cause more significant data inaccuracies:
- Track when the error message of the form appears on the screen
- Using AJAX form? Check the response when the form is submitted (maybe you’ll find something useful there)

#4.1. Using Element Visibility trigger to track form errors
Warning: For this method to work, you must become familiar with CSS selectors, which is an advanced topic.
So if you have a form that displays an error message (after the form was submitted with an error), here’s what you could do.
First of all, right-click on that error message and see what kind of classes or IDs it has. Once again, I cannot stress this enough: this method will work if you have the correct CSS Selector fundamentals in your head.
Here’s an example of what I see after inspecting a specific element (P.S. This does not mean you will see the same thing (because most websites are unique)).

Take a closer look at the class attribute of that error message. One of the classes is wpcf7-validation-errors. We could use that in our GTM trigger.
Go to Triggers > New > Trigger Configuration > Element Visibility and enter the following settings:

In CSS, all classes start with a dot. That’s precisely what we did: we entered .wpcf7-validation-errors. Also, make sure you enable the “Observe DOM changes” setting.
Let’s test whether the trigger works properly. Save the trigger, refresh/enable the GTM Preview and Debug mode, refresh the page with the form, and submit the form with one required field missing (or some other error you know).
The Element Visibility event should appear on the left side of the Preview mode panel.
Now, how can you access the text of that error message? The neat trick is that Click Text or Form Text, built-in variables in GTM, return the text from the element tracked by the Element Visibility trigger. Learn more about this here.
Now, it’s time for a tag. Go to Tags > New > Google Analytics > Google Analytics: GA4 Event and enter the following settings:
Where will you see this event in Google Analytics?
- Click on Reports > Realtime and navigate to the widget that shows Event Count by Event Name
- Navigating to the default Events report (Reports > Events)
- Creating a new Exploration report to visualize the data and the parameters involved. But remember, the parameters need to be registered as custom dimensions to be viewed in your Exploration report. Here’s a quick guide on how you can do this.
#4.2. Working with an AJAX form? Try this
If your form does not reload the page after it was submitted (or when the error is displayed), it is possible that the form was built using AJAX.
How can you make sure you’re working with an AJAX form? Click this link (credit for this code goes to Bounteous), copy the entire code, and paste it into a new Custom HTML tag within your GTM container. Set the tag to fire on All Pages. Save the container, refresh the preview mode, and navigate to where the form is located.
The custom HTML tag will fire on the Pageview event. Don’t worry about that. Now, try to submit the form again. Did the ajaxComplete event appear in the GTM preview mode? Yes? This means you’re working with an AJAX form.
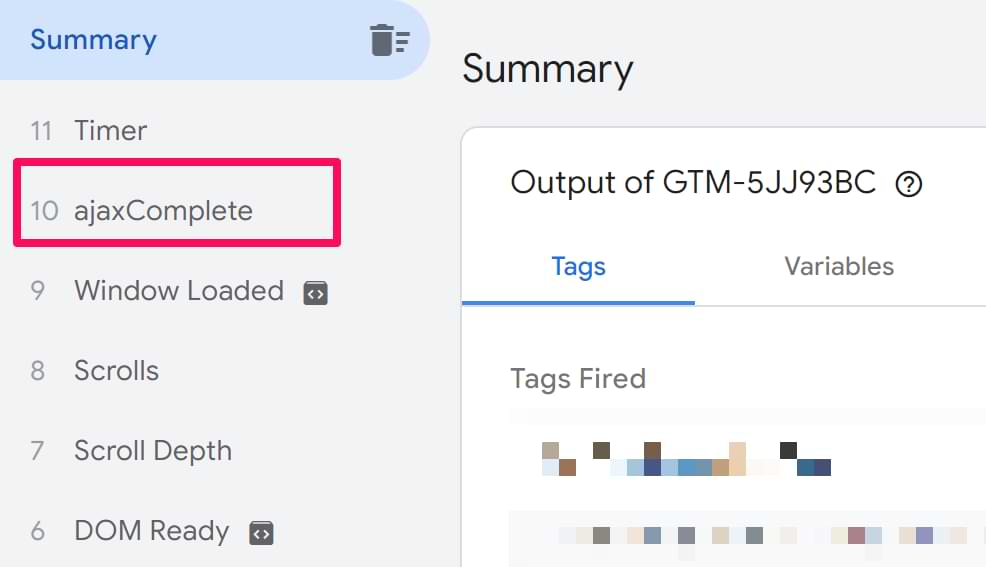
Now, try to submit a form with at least one empty required field. Did the ajaxComplete event appear again? If yes, click that event in the preview mode and go to the Data Layer tab.
Scroll down and keep looking for the response section.
Do you see something meaningful there that is related to an error? In my case, I see this (Warning: the data structure of the response might look totally different in your case):
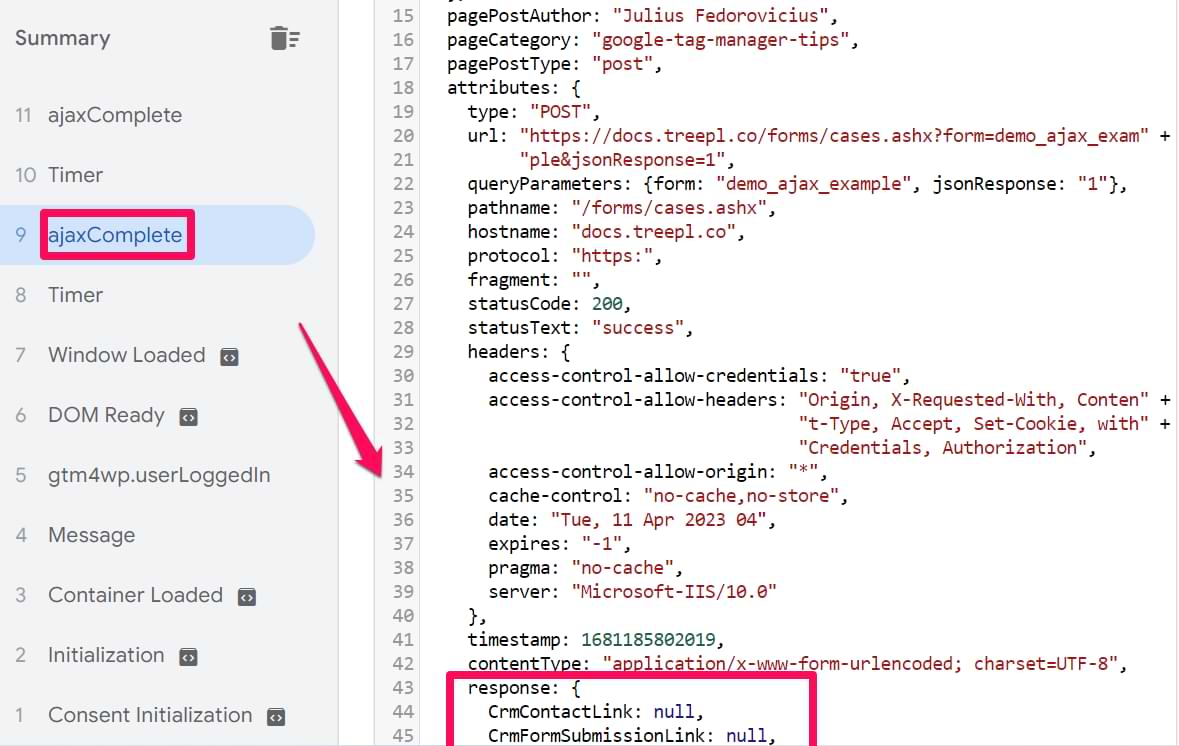
It would be cool to access that statusCode and message values, right? Luckily, we can do that.
#4.2.1. Data Layer Variables
Go to Google Tag Manager > Variables > User-defined Variables > New > Data Layer Variable.
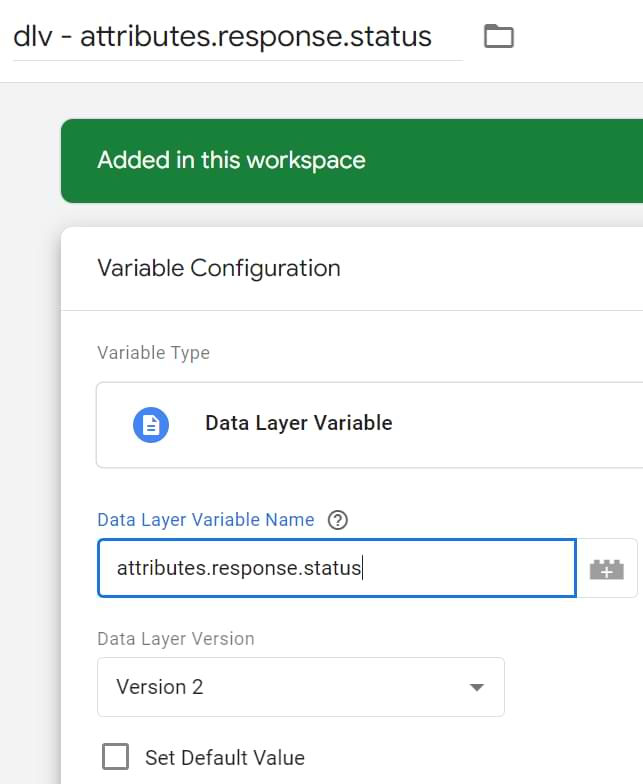
In my example, the status key is outside the object response, which is inside another object called attributes. That is why in the Data Layer Variable, you should enter attributes.response.status (if you have no clue what I’m doing here, read this guide)
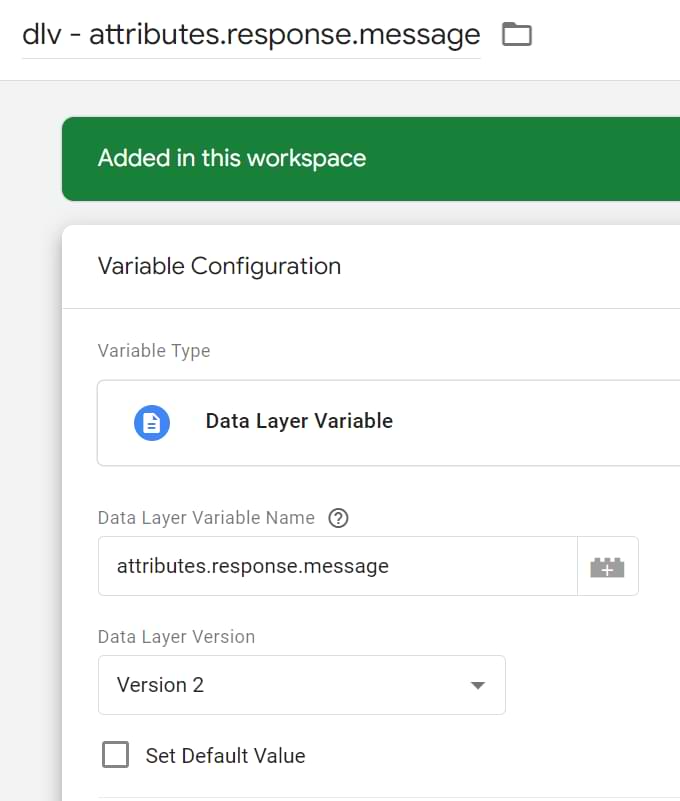
Save the variable. Now, it’s time to access the message. Enter attributes.response.message in the Data Layer Variable.
Save the variable.
#4.2.2. Trigger (when the error message is pushed to the Data layer)
It’s time to create a trigger that will be activated when an ajaxComplete will be pushed to the Data Layer and attributes.response.status will equal validation_failed.

Save the trigger
#4.2.2. Google Analytics tag
And the last step — the GA4 Event tag. Go to Tags > New > Google Analytics > Google Analytics: GA4 Event and enter the following settings.
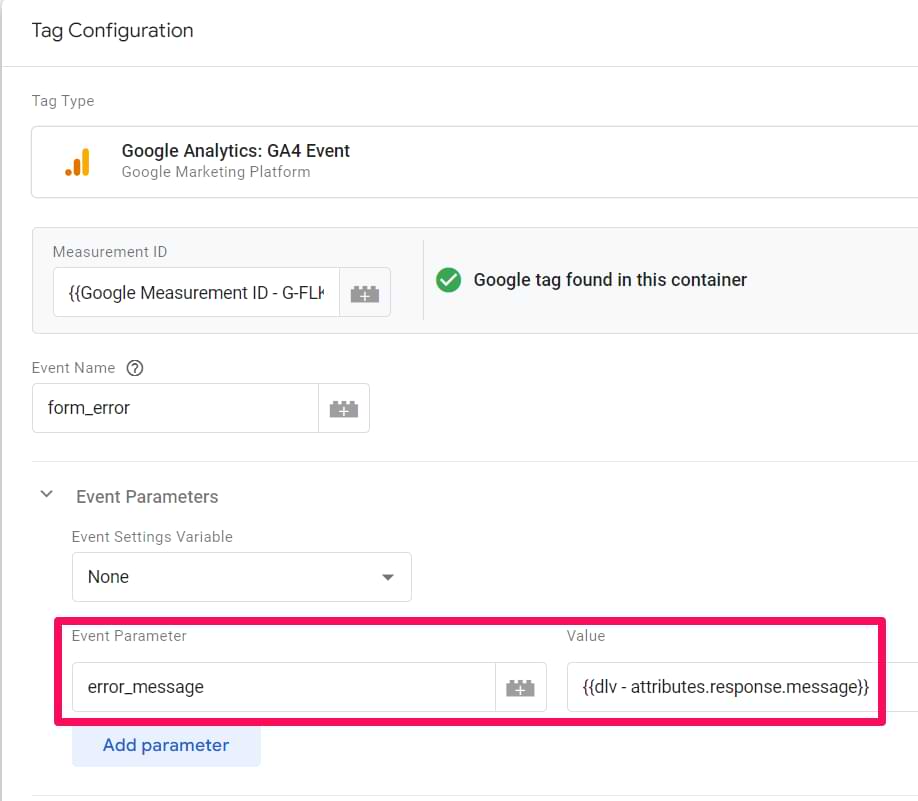
I’ve inserted the attributes.response.message as an event parameter. Whenever an AJAX form error is pushed to the Data Layer, I will pass its text/message to Google Analytics.
Important: If you have named your variables differently (e.g., not dlv – attributes.response.message), use your naming in the GA4 tag, not mine.
Save the tag, refresh the preview mode, navigate to the form, and submit it with an error. Check if the ajaxComplete event was fired and whether it is visible in the GA real-time reports. Otherwise, you can populate the event details using the Exploration report.
#5. Server Error (like 50x, etc.)
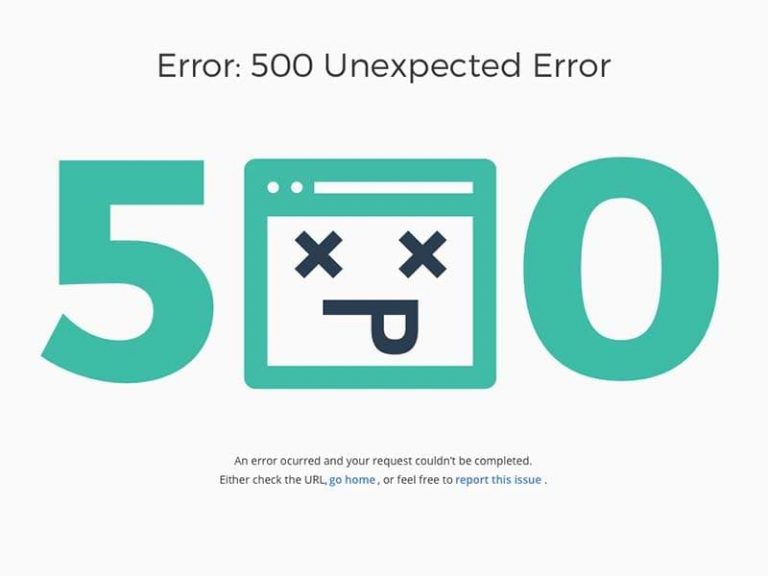
When a server error occurs on a page (e.g., “Internal server error” or “Bad Gateway”, etc.), they look like this (pardon me or an old screenshot I found online):

Simple plain text page. However, GTM (or any other snippets) on that page is not available. Thus, you cannot track them by default. As a solution (I honestly don’t know whether this is the only workaround), you could ask a developer to redirect visitors to a static error page (each error will probably have a unique error page (visually similar but with a different error message)).
For example, if a 500 error occurs, a developer could redirect visitors to yourwebsite.com/500error.html (or something like that). If 503, then yourwebsite.com/503error.html.
My examples here are totally made up. The URLs of your error pages might look totally different. However, remember that only a developer can implement these redirects to error pages.
All error pages could use the same HTML file template with some basic error information and the Google Tag Manager container snippet. The snippet is the key here. Without it, no error tracking will be possible. Some companies even go the extra mile with a custom error page design that might look like this:
If URLs of the error pages contain the error code (e.g., yourwebsite.com/500error.html), you can implement the same method I’ve explained in #2.1 chapter of this article.
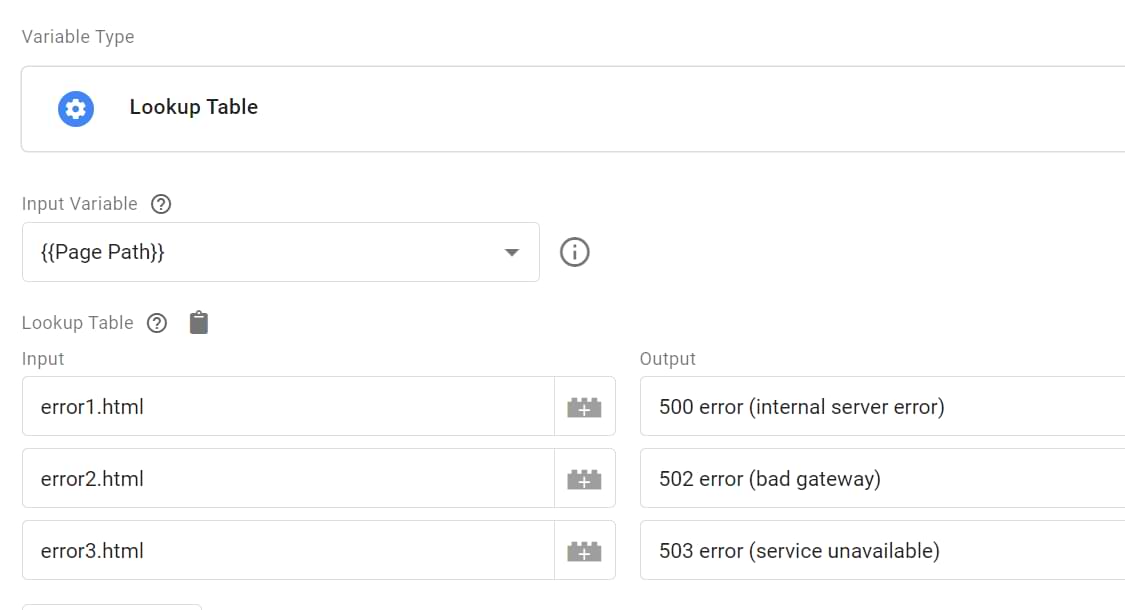
If the URLs aren’t very friendly, e.g., yourwebsite.com/error1.html means 500 error, then you could implement something like this. Create a Lookup Table or Regex Table variable that will check the Page Path and return a more meaningful/readable value.
#5.1. Lookup Table Variable
For this example, I will use a Lookup Table variable (that will be looking for exact matches).
A hypothetical situation. Our website has five error pages for different types of server errors:
- mywebsite.com/error1.html is for error 500 (if you are not familiar with error codes, here they are)
- mywebsite.com/error2.html is for 502
- mywebsite.com/error3.html is for 503, etc.
Here is what we could do. In GTM, go to Variables > User-defined Variables > New > Lookup Table. Choose {{Page Path}} as an input variable. Then create separate rows for each error page.
Since we will be working with a {{Page Path}}, we must enter what comes after the slash in the URL, e.g., error.html. Let’s do that:

Then, on the right side of each column, enter the output you want to use (in other words, we will turn the ambiguous error.html into 500 error).
If, in the future, you plan to implement more error page templates, it’s a good practice to set the “default” value of the table variable. If none of the conditions/rows is met, this variable will default to the {{Page Path}}.

Save the variable.
#5.2. Trigger
Now, let’s create a trigger that will be activated when the visitor loads an error page. Go to Triggers > New >Trigger Configuration > Pageview and enter the following condition:

In our case, Page Path or an error page starts with “error” and ends with “.html”.
#5.3. Tag
Finally, create a Google Analytics event tag to send the error to GA4. Go to Tags > New > Google Analytics Google Analytics: GA4 Event and enter the following settings.

Important: I later realized that Google has reserved the “error” event name and we should not use it. So instead of “error” event name, use “server_error”
With the help of the Lookup Table variable, you will be sending the actual error codes to GA.
Assign the pageview trigger to this tag, and save it. Don’t forget to test and then publish your changes.
Several Tips Regarding Error Naming Convention
This is NOT some hard rule that you MUST follow. It’s up to you how you will name your events in Google Analytics. But I prefer that all event names contain the word “error”. But it’s up to you to decide.
Then the event name could also contain the type of the error:
- Page not found (e.g., event name could be page_not_found or page_not_found_error)
- server (e.g., server_error)
- form (e.g., form_error), etc.
You can send the event message as an event parameter error_message, describing the nature of the error. What exactly was the error? For example:
- If the error is in the checkout, an error message/text would be valuable (like “credit card declined”)
- If the error originated from the server-side, then the error code (e.g., 503) and the location (URL) would be nice (or at least the error code)
- If the error is related to a form, then I’d like to know the error text
You get the idea. But once again, these are just my thoughts. You are free to choose a different naming convention.
Also, don’t forget to register custom dimension(s) if you send custom parameters with events to GA4.

Example of a setup + Reports in Google Analytics 4
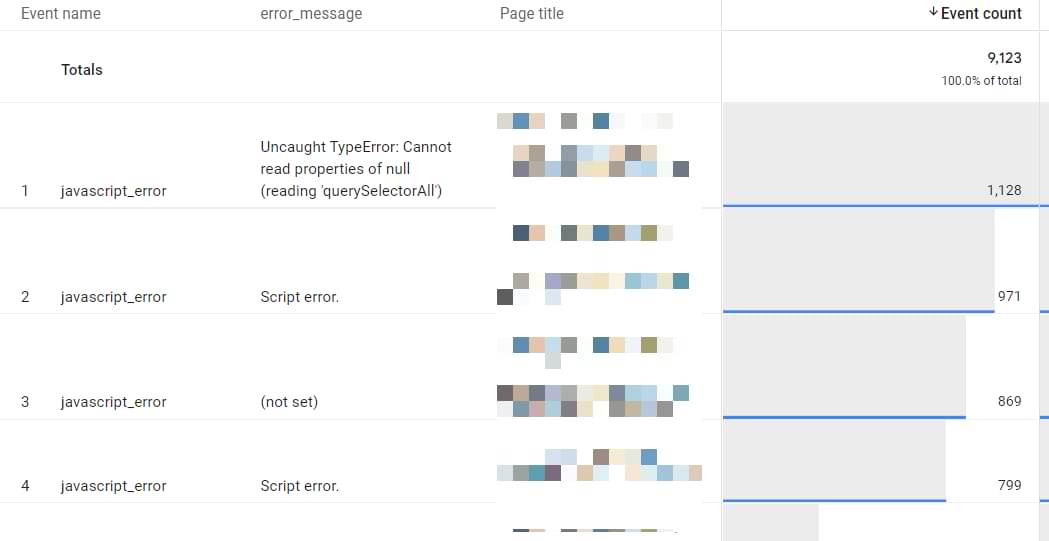
Enough of a theory. How about a practical example? Let’s say that we want to see which pages have the most JavaScript errors.
To do this, let’s begin by adding an event tag that fires every time there is an error with the website. In this case – Javascript errors, for example:
- cannot read properties of null (reading ‘addeventlistener‘)
- cannot read properties of null (reading ‘queryselectorall‘)
- null is not an object (evaluating ‘readmorebtn.addeventlistener‘)
Head over to Google Tag Manager, and enter the following settings into the new tag.

As the trigger for the event, use the built-in trigger for Javascript errors.
Save your changes and publish the container.
Remember to add custom parameters from the tag as custom dimensions inside the GA4 interface.
Using this, you can now see the instances of Javascript errors and where they occurred inside your Exploration reports.
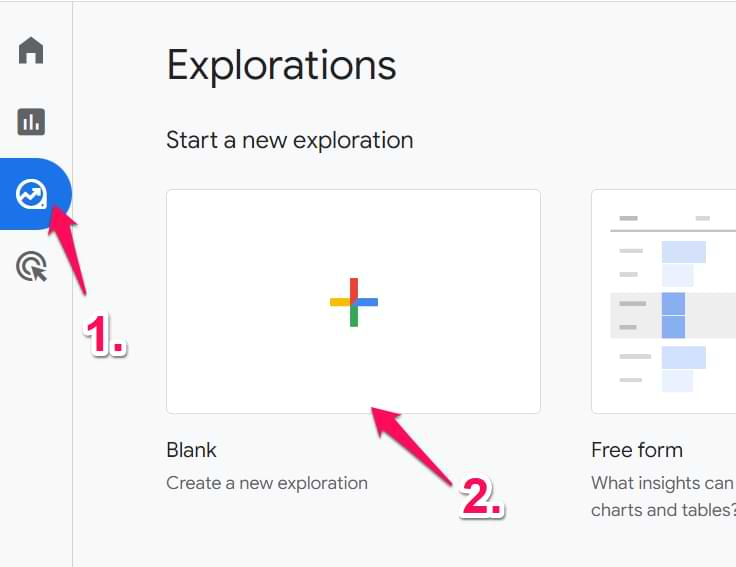
How do we do this? I will explain it simply here to address the topic at hand. However, there’s much more to learn about creating exploration reports, so you should read it.
Navigate to Explore and select Create a Blank Exploration.
The new page that opens will allow you to customize your report as you see fit. You’ll see various options to modify the report, but we will focus on the ones in the screenshot below.
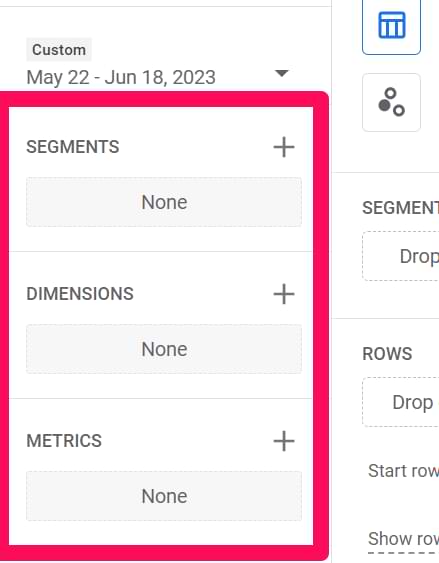
Add the following metrics to the Dimensions and Metrics section.
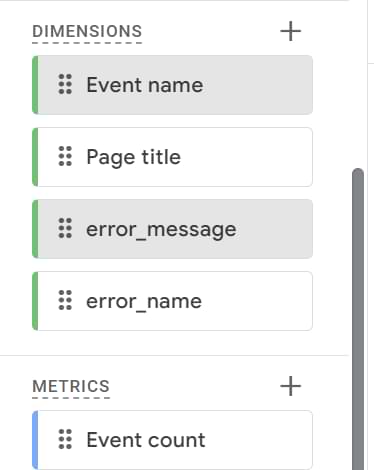
To avoid any stray details entering the report, we must restrict the report to show results only when the Event Name exactly matches javascript_error.

The final report should appear like this.
If you need more clarity on how to use Exploration reports, I have a detailed article which you can read here.
Final words
These were some of the ideas about Error Tracking with Google Tag Manager. Every business is different; therefore, the types of errors that you can/will measure will also be different.
Personally, I always try to track:
- Form-related errors
- Checkout errors
- Registration errors
- “Page not found” errors
The first three are directly related to revenue or lead acquisition (that may eventually lead to revenue increase). “Page not found” errors are easy to track and may help you identify missed opportunities when a visitor lands on your page, finds nothing, and bounces.
Got something to add? Use the comments section below!
4 COMMENTS
Very nice blogs on GTM. Really informative.
I have a question about how can we track how many fields filled with a form on submission?
Hi iqbal,
We can get number of fields that the user has filled in a form by using innerText of the form input field i.e if a user has entered something in the field you can store it in a global variable and then pass it to data layer variable likewise other fields too. Unfortunately, GA does not allow (PII)the Information of the user. The simplest thing you can opt for is to use an asterisk(*) all fields required.
Thanks
what a amazing article!!
my client was asking me about a error ergo generate a .json inside the network when a for is not fiel well… is that any chance we could tag this??
OMG - THIS! Spent WEEKS troubleshooting why errors weren't registering in GA4!! I could kiss you!
"Important: I later realized that Google has reserved the “error” event name and we should not use it. So instead of “error” event name, use “server_error”"