
May 7, 2025
How to Customize Reports in Google Analytics 4
Google Analytics 4 has far fewer built-in reports than its predecessor (Universal Analytics). However, you can customize and adapt the reports according to your needs. The customization process is not perfect (I will talk about that, too), but it can still cover many use cases.
In this tutorial, I will show you how to customize reports in Google Analytics 4 and share several ideas to get started.
Note: this article applies to standard reports only (a.k.a. the Reports section on the left sidebar). If you want to learn about Explorations (the Explore section of the left sidebar), read this article instead.
Table of contents
– Hide table of contents –
- Two types of standard reports
- Where to start?
- Customize a single report in Google Analytics 4
- Saving changes in the report
- Library in GA4
- Create a new report in Google Analytics 4
- Examples of customized reports
- Final Words
Video tutorial
If you prefer video content, here’s a tutorial from my Youtube channel.
Two types of standard reports
There are two types of standard reports in GA4, detail reports (where the main focus is on the table and charts. Example: Reports > Engagement > Events) and overview (where you see cards/widgets. Example: Reports > Engagement > Engagement overview).
Here’s an example of a detail report.

And here’s an example of an overview report.

Where to start?
There are two places where you can customize the reports:
- You can either open any standard report (in the Reports section) and then click the Customize report button
- Or you can go to the Library and create/edit reports there
Remember, customized reports are visible to all users of a Google Analytics 4 property.

Customize a single report in Google Analytics 4
To customize any single report, go to that report and click the Customize report button in the top-right corner.

If you don’t see the button there, this means you don’t have enough permissions in that property.
After you click the button, the interface will switch to report-editing mode. On the right side, a sidebar will appear containing the following sections:
- Report data (where you can manage dimensions and metrics). Available if you are editing the Detail report.
- Report filter. Available in the Detail report.
- Charts. Available in the Detail report.
- Report template. Available in the Detail report and an Overview report.
- Summary cards. Available in the Detail report.
- Cards. Available in an Overview report.
Dimensions. To add/remove primary dimensions, click the Dimensions button in the Report data section. These dimensions will be displayed as the first column of the report table. If multiple dimensions are included in this list, GA users will be able to select them in the dropdown of the first column.

Currently, you cannot add secondary dimensions directly in the customization (so that both dimensions would be displayed by default).
Metrics. Metrics are numbers that will be displayed in all other report columns. However, not all combinations of dimensions and metrics are possible. For example, you cannot combine item-scoped metrics/dimensions with event-scoped metrics/dimensions (e.g. item name and event count).
Report filter lets you add conditions and show a subset of your data. You can add up to 5 conditions in a filter. An example of a filter could be “Include hostname xxxxx.com” (this would show data only tracked on that hostname, rather than all websites tracked by this GA property).

Charts. Honestly, the current options of data visualizations in standard reports are not good: bar chart, line chart, and scatter chart (I haven’t met a person who likes/uses scatter chart in GA). The problem with these charts is that they visualize the top 5 rows of your report. Instead, I would like to see a line chart where I can see the total numbers of a particular metric (e.g. total number of pageviews), but that is not available now. Usually, I use this section to hide the charts and focus only on the table. You can hide visualizations by clicking the eye icons next to the chart name. And if you want to replace one chart type with another, click the chart name and select a different option.

Report template. Occasionally, Google publishes updates to their standard reports (sometimes, they might even break them). So if your report is linked to a standard template, it will be displayed like this:

But sometimes, you might want to customize a report so that the link will eventually have to be broken. But don’t worry. If you ever want to rebuild the report, you can create a new one from the library (I will cover the GA4 library later in this blog post).
Summary cards. This is the section where you should be able to add summary cards, at least in theory. However, when I tried to add a summary card to a Detail report, none of my cards was displayed. Maybe there’s a bug, or maybe I am missing something.

Cards. Here you can add up to 16 cards (if you are customizing/building an overview report). You are free to rearrange them, and if you want to add a card, click Add cards and then select from one of the available templates.
If one of the card templates has a number in it (e.g. +1 or +2), this means that there will be more than one metric available in the card.

Last (but not least), you can rearrange cards by dragging this icon:

Saving changes in the report
Once you are done with the changes, click Save at the top right corner. Here you can select whether you want to save changes in the current report (or do you want to save it as a new report).

However, keep in mind that saving a new report will not make it visible on the sidebar. You will need to publish it later (and that’s where you must become familiar with Library).
Library in GA4
Library is a place where you can manage your standard reports (default and customized). Here you can group those reports into topics and collections and decide which reports are published (meaning they will be visible on the sidebar).
Collection is a top level of standard reports. By default, GA4 shows two collections of reports: Lifecycle and User (but of course, there is a chance that in the future, this setting might be expanded).
If we drill down a bit, the next (lower) level is Topic. One collection can consist of several topics. For example, Lifecycle collection (by default) contains Acquisition, Engagement, Monetization topics. Each topic consists of a set of reports.

To get started, go to Reports > Library.
Here you will see a list of available (published and unpublished) collections. Inside a card of each collection, you will see a list of topics.

Below that list, you will see Reports. All of the default reports will already be there.
Create a new report in Google Analytics 4
If you want to create a new GA4 collection, first, you need to click a large Create new collection button. To add a report to an existing collection, click Edit collection.

However, before you do that, first, you have to create the actual report.
Let’s say we want to build a report of only one subdomain (because maybe our property is collecting data from multiple subdomains). This will be a lightweight workaround for the views of Universal Analytics.
Click Create new report and then choose to Create detail report.

Let’s say that in this report, we will be focusing on our top traffic sources. Select the Traffic acquisition template.

If you want, you can add/remove metrics and dimensions. In the Report filter, click Add filter and enter the following condition (obviously, you should use a different value of the hostname):

Click Apply.
Once you are done with customizations, click Save and enter the report’s name, for example, Traffic sources: aaa.xxx.com. Click Save.
Now, click Back and edit the collection where you want to include that report (because the report you just saved is still not included/visible in the left sidebar).
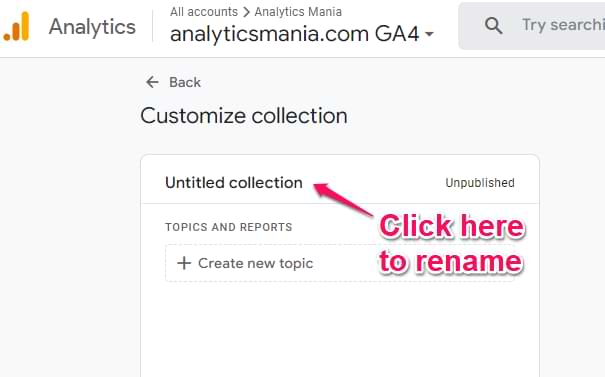
Let’s say I want to create a collection of reports just for the www.analyticsmania.com subdomain. That’s why I’ll click Create new collection > Blank. Enter the name of your collection by clicking here:
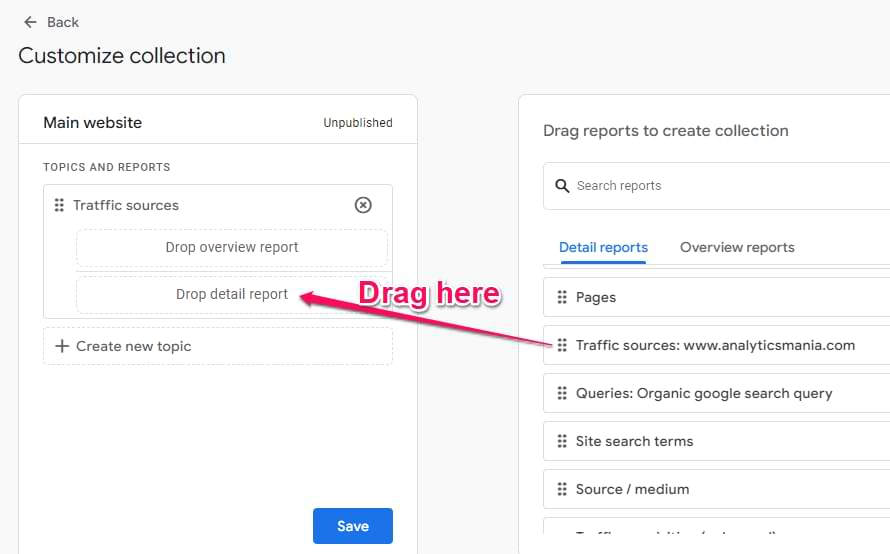
Then you have to create at least one topic. In this case, I will enter “Traffic sources”. After you create the topic, find your recently created report on the right and drag it to the left sidebar.
When you are done, click Save. Once you are done adding new reports to that collection, click three dots in the card of that new collection > Publish. This will make the collection and all of its reports visible on the left sidebar.

However, I could not find a way to rearrange collections. Hopefully, Google will add this in the future.
And that’s how you create or customize reports in Google Analytics 4. If you want to delete the report, click three dots next to that report in the Library.

Examples of customized reports
To give you some inspiration, here are several examples/ideas of what you can customize in GA4. I have already shown how to view data only of a particular subdomain/hostname. But here are several more.
Report of pages visited by mobile traffic in Google Analytics 4
The easiest way to achieve this would be to open a standard report in Reports > Engagement > Pages and then click Customize report. Then keep all the settings as they are and add a filter: device category is mobile. Click Apply.

Then click Save > Save as new report and give it a name (e.g. Pages on mobile). Go back to Reports > Library and edit the Life cycle collection (if you want to include the report in that collection). Now drag the newly created report to the Engagement topic and save the changes to the current collection.

Done! Your report will look like this, and it can be accessed by going to Reports > Engagement > Pages on mobile. All users of that GA4 property will be able to see/access that report.

Google Search Console report
If you have connected Google Search Console to your GA4 property, this connection automatically creates a new collection. Go to Reports > Library and keep looking for Search Console. Then click three dots next to it and hit Publish.

Honestly, I am surprised that this is needed at all. If I connect Search Console with GA4, I would expect to start seeing this report collection by default on the sidebar.
Site search terms
If your website has a site search and you are tracking that with Google Analytics 4, you will have view_search_results in your reports. However, it would be more convenient to see a dedicated report just for that event, where the primary dimension is Search Term.
Luckily, with this customization feature, you can do that (although there are some caveats). Let’s create a new report. Go to Reports > Library > Create new report > Create detail report > Blank.
In the Dimensions section, add the following: Search term. Click Apply.

In the Metrics section, add the following metrics: Event count, Total users. If you want, you can also add Event count per user (maybe some users search the same thing multiple times).

By default, this report will show data of all events (e.g., page_view, click, etc.). To make this report specific just to search data, click “Add filter”, select “Event name”, and then “Exactly matches” view_search_results.

Then click Apply.
Hide all charts by clicking the Eye icons next to them. Click Save and give this report a name, e.g., Site search.
Finally, go back to the library and include this report in one of the collections (e.g., Life cycle > Engagement). The final report will look like this:

And then don’t forget to add this report to the collection of your choice and publish those changes.
Customize Standard Reports in Google Analytics 4: Final Words
In conclusion, the customization of reports in GA4 can help you polish a lot of rough edges that the standard reports have. That way, you can tailor the interface to the needs of the users who will be using the data.
However, if you are working with multiple clients, repeating the same customization process over and over again will be cumbersome. Hopefully, that will be addressed in the future.
In the meantime, start thinking about what customized reports you can create now.
And if you want to go more advanced, start diving deeper into explorations, e.g. Free form or Funnel explorations.

5 COMMENTS
"For example, the previous example of site search keyword report. I wish we could create a filter based on the event name. That way, I could build a report on particular event(s)."
I came here to know how to filter by event.name just to see that its not possible. A real bummer and an obvious miss from Google.
Yeah, I agree. A current workaround would be to send a custom dimension for "event" and then use that in the filter.
Hello! I tried to create a custom detailed report for a specific event (a custom event, clicking a chat window). However, I wasn't able to select "Event name"-dimension from the Report filter selection. Why is that? What do I miss? I managed to create this kind of report in the Exploration reports, but I'd prefer it in the Library collection. Is there another way to create a detailed report with just one event? Thank you in advance, your tutorials have been extremely helpful.
Thanks for you post, summary cards are displayed on overview reports. So if you want to create a custom summary card you need first to create on on a detail report and add it then to an overview report.
Since the latest GA4 update, it is possible to add a maximum of 4 key metrics directly to a Custom Overview Report. I find this feature very useful, for example, when including metrics like average session duration, engagement rate, and so on.
However, I’ve noticed that I’m not able to do this across all properties, some propreties has this features, and some other not and I can’t figure out why. Do you have any idea what this might depend on? I haven’t been able to find any information about it anywhere.