
October 30, 2025
Google Tag Manager Preview Mode Not Working? 26 Ways To Fix It.
Updated: October 30th, 2025
Is Google Tag Manager Preview Mode not working? I’m pretty sure we’ve all been there at least once. You click the ‘Preview’ button, but the debug panel doesn’t work on your site, shows ‘Not Connected’, or maybe it connects but doesn’t update when you navigate pages. It’s a common headache!
Usually, the GTM preview mode not working boils down to one of these main areas:
- GTM snippet issues: The code isn’t installed correctly, it’s the wrong code, or it’s being modified by your site’s code or server.
- Browser problems: Extensions, cache, cookies, or even the browser itself might be interfering with the preview mode’s connection or cookies.
- GTM configuration: You might be previewing the wrong container, workspace, or environment, especially if using GTM’s advanced features.
- Website conflicts: Content Security Policies, cookie consent mechanisms, or server settings could be blocking necessary scripts or cookies.
Just don’t rage quit. Read the following tips on fixing Google Tag Manager Preview and Debug mode. I’m sure at least one of them will apply to your issue.

Table of Contents
Here are the reasons and solutions why GTM preview mode is not working:
- If you manage to solve the problem by yourself
- #1. GTM Snippet is Not Added to the Website
- #2. Wrong or Incorrect Container Snippet Added to the Website
- #3. You Have Enabled GTM Preview and Debug Mode in the Wrong Container
- #4. You Need To Use The Same Browser
- #5. Try clearing browser cache and cookies
- #6. Try disabling the preview mode’s query parameter
- #7. Cloudflare Is Altering the Way GTM.JS Is Loaded
- #8. GTM code was accidentally modified while copying/pasting it
- #9. Check if your browser is not blocking popups and redirects
- #10. Try publishing the container (even if the container is not new)
- #11. Try exiting the preview mode and entering it once again
- #12. AdBlocker, Ghostery, or Other Similar Extension Is Blocking GTM
- #13. Your website is using an automatic solution that blocks cookies
- #14. Make sure you have selected to correct GTM container in the top left corner
- #15. You might be previewing a workspace instead of an environment
- #16. Don’t use Brave browser while working with GTM
- #17. Website’s domain is on http (not https)
- #18. The content security policy is blocking the GTM from loading
- #19. GA Debugger Extension affects GA4 debugging in the Preview mode
- #20. Try to relaunch/restart your browser completely
- #21. Your cookie consent solution blocks GTM
- #22. An array (pushed to the Data Layer) broke it
- #23. Your VPN might be blocking Google Tag Manager
- #24. TikTok Pixel helper
- #25. Try remove the “Tag Assistant” Chrome extension
- #26. Using WordPress and logged in to the admin panel?
- None of the tips worked?
- Conclusion
Video tutorial
I have picked the most common issues and compiled them into a video. Take a look.
If you manage to solve the problem by yourself
If you find a solution to your problem by yourself (and that solution is not mentioned in this article), please let me know in the comments. I’ll make sure to update the guide accordingly, thus more people will benefit from it.
#1. GTM Snippet is Not Added to the Website
Here’s an example: you asked a developer to follow Tag Manager’s instructions and add a container snippet to the website. After some time, he completes the task, but something’s not right here – Preview and Debug console still does not appear after you enable it. Turns out the snippet was never published to the live version of your website – a developer made a gawky mistake and somehow failed to publish changes.
There are various ways to verify the GTM snippet implementation. To name a few:
- Use the Tag Assistant Chrome extension, which checks for Google pixels on the page (e.g. Google Analytics, Google Ads, Google Tag Manager) and provides real-time feedback.
- Check the website’s source code. Click Ctrl + U (I guess it’s CMD +Option + U for Mac users?) in your browser and look for the GTM container code there.
#2. Wrong or Incorrect Container Snippet Added to the Website
Although this tip might sound silly, you should not ignore it. In order to verify, open your GTM account and check the upper right corner of the screen – see GTM container ID.

Compare it with the one that is added to your website’s source code. Tag Assistant will help you do that.
Also, remember that you or your developers should not modify the GTM container snippet. It must be added to the site exactly as you have copied it from the GTM interface.
#3. You Have Enabled GTM Preview and Debug Mode in the Wrong Container
The more Google Tag Manager accounts and containers you have, the bigger the chance you’ll eventually make this mistake. I have been there more than once, and it keeps getting more and more frustrating every time. So do not forget to double-check whether the container is right. You can follow the method described in tip #2.

#4. You Need To Use The Same Browser
When Preview and Debug mode is enabled, it opens a new tab/window with the website that you are going to debug. If you then try to open Chrome’s incognito mode (or another browser’s private mode), that will not work.
#5. Try clearing browser cache and cookies
You can try clearing your browser and trying to debug again. Instructions to clear the browser (cache and cookies) differ on each browser; thus, you will need to google that. For example, use “How to clear browser cache and cookies on [insert your browser name]”.
#6. Try disabling the preview mode’s query parameter
When you want to enable the Preview and Debug mode, it adds a gtm_debug=x parameter to the URL. This is the default behavior. However, some websites do not support custom URL parameters, hence might not work (or throw things like “404 Page Not Found” errors).
If that is your case, try disabling this checkbox (see the screenshot below):

#7. Cloudflare Is Altering the Way GTM.JS Is Loaded
This tip comes from our reader Chris.
A Content Delivery Network or CDN is designed to cache the static content on sites through a wide geographic network. The end result of using the CDN is that the static content will be delivered faster to the visitor from the network node in the closest proximity to the visitor, thereby shortening the amount of time it takes the page load for your site’s visitors.
CDN also affects how JavaScript is pulled, and gtm.js (Google Tag Manager’s JS library) isn’t an exception. If you’re using Cloudflare (a very popular CDN solution), make sure you have the feature called Rocket Loader disabled. If Rocket Loader is interfering, you might experience:
- The GTM preview panel connects initially but then fails to update or disconnects when you navigate to other pages.
- Tags firing inconsistently or not at all within preview mode.
- Errors related to JavaScript loading order in the browser’s developer console.
Rocket Loader tries to optimize JavaScript loading, but this can sometimes interfere with GTM’s own script execution and the preview mode’s communication mechanism. Disabling it for your site within your Cloudflare settings often resolves these issues. I highly recommend consulting your developer about this issue.
#8. GTM code was accidentally modified while copying/pasting it to the developer
This situation happens when you want to send the GTM container code to a developer, copy it from the tag manager’s interface, then paste it to some word file (maybe Google Docs or some other text editing tool) and then send the code to a developer.
However, word processing tools like Microsoft Word or Google Docs often automatically replace standard straight quotes (‘ or “) with ‘smart’ or curly quotes (‘ ’ or “ ”), or make other subtle changes to spacing or characters. While visually similar, these curly quotes are not valid in JavaScript code and will break the GTM snippet.
Even though the code looks the same (at first sight), it won’t work (meaning that your Preview and Debug mode also won’t appear).
Here’s an example. On a website, a developer added a GTM container snippet. However, if you look closely at the apostrophes (in the screenshot below), they look wrong.
In JavaScript, apostrophes must be ‘ ‘, but in the screenshot below, they are ‘ ’. Similar, but not the same.

A solution to this? Copy the GTM container code in the GTM interface and paste it to the .txt file (e.g. via Notepad), save the file and then send it to a developer. An alternative solution would be to copy the code and paste it to pastebin.com. Save the paste and then forward the link to a developer. When a dev opens the link, he/she will see the raw/unmodified code.
#9. Check if your browser is not blocking popups and redirects
When you click the Preview button in the GTM interface, a new tab or window will be opened that belongs to tagassistant.google.com. Sometimes, a browser might not like it and block it.
If you are using the Chrome browser, you might start seeing this in the GTM interface:

For me, this happens inconsistently. Sometimes, Chrome blocks the window, and sometimes not.
Anyway, if you see that the browser blocked the tagassistant.google.com tab/window, click that icon and select Always allow popups and redirects… and click Done.

This enables this setting only for Google Tag Manager, so don’t be afraid of opening some pandora’s box.
If you are using a different browser, that “blocked” warning might look different. You will need to do some further investigation on your own.
#10. Try publishing the container (even if the container is not new)
Some people mentioned that they published the container before enabling the preview mode, which helped them. Since that moment, their debugging experience was smooth. I couldn’t verify it, but it’s still worth a shot.
#11. Try exiting the preview mode and entering it once again
Close the preview mode’s tab, and close the website tab. Then click the Preview button once again in the GTM interface and complete all the steps to enable it. This worked for me multiple times.
#12. AdBlocker, Ghostery, or Other Similar Extension Is Blocking GTM
Call it a feature or symptom of today’s web browsing behavior, but the ad and content blockers are making life for web analysts difficult.
Popular browser extensions like Ghostery, AdGuard AdBlocker, and AdBlock Plus make it easy to block Google Tag Manager, too. So if you’re using one of the blockers, try disabling them and see whether it helped. So if you want to have a working preview mode, you’ll need to disable the extension.
Other plugins (that are reported by readers as interfering with the GTM preview mode) are:
- Avira Save Shopping
- DuckDuckGo privacy
- Windscribe VPN
- uBlock Origin
#13. Your website is using an automatic solution that blocks cookies from being set
With the dawn of GDPR and other privacy-related regulations, some website owners decided to use automatic cookie-blocking solutions connected to their cookie consent popups. Some examples are:
Unfortunately, I don’t have the specific steps on how to resolve this (because every tool will probably have different steps). But in general, you need to ensure that the cookie named _TAG_ASSISTANT (all uppercase) is allowed to be set.
The Preview mode must work. If you are not sure whether your website is using auto-blocking, consult with someone more familiar with your cookie-consent-management tool and the website that you are working with.
This will require some investigation from your side.
#14. Make sure you have selected to correct GTM container in the top left corner
If there are more containers on a site (but you have enabled the preview mode in just one of them), you may be currently previewing the wrong container.
In the tool left corner of the Preview mode, you might see a little arrow-down icon. If yes, then click and check if you are previewing the correct container. If not, pick the right now.

Update: the design there looks a bit different now. The container IDs are more visible.
#15. You might be previewing a workspace instead of an environment
Note: try verifying your GTM environments even if you don’t see the same warning in your preview and debug mode (as I have described in this chapter).
Here’s a situation. You enable the preview mode, and you see the message “No tags were evaluated in this container”. You don’t see any events (like Container Loaded) on the left side of the preview mode (all you see there is just the title of the page).

Also, you don’t see an arrow-down icon next to a GTM container ID at the top left corner of the preview mode. In that case, it’s most likely that you are trying to preview the workspace rather than the environment. It is quite confusing but let me try to explain. It will take a while to explain, but this is important. Otherwise, you might be even more confused.
When GTM is installed, developers usually add the GTM Container code that can be found by clicking on the container ID in the interface.

This is the regular GTM container snippet (not having any environment parameters). When you enable the preview mode by clicking the PREVIEW button in the top right corner of the GTM interface, you enable the preview mode for that particular snippet.
However, GTM offers the functionality of environments. You can create different environments, like development, staging, or something else. To install it, your developer has to get separate snippets for each environment and place it in the respective versions of your website. For example, place the staging GTM container on staging.yourwebsite.com.
To get the snippets for environments, you need to go to Admin > Environments > Click Actions next to an environment > Get snippet, and then a developer should place it on the website. By default, there are two environments, but you can create more if you need it.

Here’s the catch: if you want to create a custom environment like development or staging, create a new environment and get their snippets installed on respective versions of your website. But, when it comes to a live website, you should not use the LIVE environment’s snippet. Instead, click on the ID in the GTM interface and ask a developer to install that one.
So, where is the problem after all?
Sometimes developers add the Live environment’s snippet to the live website. That snippet looks a bit different compared to the default GTM snippet.

If you have an environment snippet (with additional parameters) implemented on the live site AND you try to enable the preview mode by clicking the PREVIEW button, it will not work. And you will get the “No tags were evaluated in this container” message. That is happening because you enabled the preview button of the current workspace (but not in a specific environment).
If you want to enable the preview move in the environment snippet, then you must go to Admin > Environments > Choose the environment that you want to preview (for example, it might be Live environment of your live website) > Actions > Share Link and then use that to access the environment.

Important: your GTM container must have at least one version published before you can see the Share Link option.
Yes, this might sound confusing, and hopefully, the GTM team will improve the flow in the future. But if you are, in fact, dealing with GTM environments, the only way how you can preview the environment now is to go to Admin > Environments > Actions > Share Link.
And if you need this even on the live website, then ask developers to replace the Live environment’s snippet with the default GTM container snippet that you can find by clicking the container ID in the GTM interface.
How can you find out whether your GTM container (installed on your live website) is not using the Environment’s snippet? You will need to check the website’s source code (by using the View page source feature in the browser) and then compare that snippet to the default GTM snippet.
#16. Don’t use Brave browser while working with GTM
Brave browser is known to be blocking various endpoints related to Google. This includes Google Analytics, Google Ads, but also Google Tag Manager. If Brave is your main browser, you have two options when it comes to working with GTM:
- Use a different browser just for work with GTM (e.g. Chrome or Edge because there are many useful GTM-related extensions)
- Or disable the main security feature of Brave browser called Shields
I would, personally, just use a different browser because having Brave with Shields disabled makes it pretty much useless.
#17. Website’s domain is on http (not https)
I don’t know (yet) if there is any other workarounds for this, but it looks like GTM preview mode does not work if your site does not have an SSL certificate. In other words, the URL must contain https, not http.
If that is your case, it’s time to update and make your site more secure. Contact your developer/webmaster and ask him/her to add the SSL certificate and make sure that the web is loaded from https.
#18. The content security policy is blocking the GTM from loading
If your website has a Content Security Policy, it might block GTM’s preview mode. You can identify this by going to your browser’s developer console (On Windows, Chrome, you should go to Browser’s Menu > More Tools > Developer Tools > Console.
Then refresh the page. If you can find an error that looks like this (or something similar), this means that you are dealing with the Content Security Policy.

What does that mean? Your developers will have to update the CSP of the website. There are no workarounds, you won’t avoid developers here. Here are the instructions on what they should do.
#19. GA Debugger Extension affects GA4 debugging in the Preview mode
You probably have noticed that if GA4 is loaded on a site, you will see its ID at the top of the preview mode. If you click it, you will see all requests that were sent to Google Analytics 4 from your website (page by page). This is useful.

But sometimes you might see a list like this (without any detailed information). If yes, this is happening because you have activated a Chrome extension called GA Debugger. If it is enabled, GTM preview mode stops reporting on GA4 debugging. However, it has NO IMPACT on regular GTM debugging, and your tags will still fire just fine. The only thing that’s affected is dedicated GA4 debugging.

Your hits are still sent to GA4. They are just not displayed in the preview mode. To fix this, you will have to turn off the GA Debugger extension.
#20. Try to relaunch/restart your browser completely
This means that you have to completely close it, and make sure that your browser’s process is not running somewhere in the background. For example, in Chrome, click three dots in the top right corner and then click Exit. Click the X button to close the browser window WILL NOT HELP.

Then launch the browser again and see if that helps.
#21. Your cookie consent solution blocks GTM
Some websites implement cookie consent solutions (like OneTrust) and configure them to block GTM completely until a visitor agrees to be tracked. In that case, the preview mode will work only after “I agree” (or whatever) is clicked.
So when you try to enable the preview mode, you will be redirected to your website. Click “Agree” in your cookie consent bar and see if that helps.
#22. An array (pushed to the Data Layer) broke it
Sometimes a little piece of code on your website can break the data layer. There are multiple ways how things can go wrong and here is one of them. In that quick blog post, I mentioned that if something like this is visible in the code:

…it will break the data layer, and you won’t see anything useful in the preview mode. What’s the solution? Cooperate with developers and ask them to remove that code. Or disable the website’s plugin that is adding this code.
Which plugin is causing this problem? Difficult to say (because different websites might use different plugins). You will have to investigate this with your developers. Read this to learn more.
#23. Your VPN might be blocking Google Tag Manager
Some Virtual Private Network (VPN) services include additional security features beyond just encrypting your traffic. These often function like built-in browser extensions or network-level filters that block known tracking domains, similar to extensions mentioned in Tip #12.
Because GTM loads scripts from googletagmanager.com and communicates with tagassistant.google.com, these domains might be on your VPN’s blocklist. This can prevent the GTM script from loading or block the communication needed for preview mode to connect.
If you suspect your VPN is the cause, try temporarily disabling it and testing GTM preview mode again. If it works, you may need to adjust your VPN’s settings (if possible) to ‘allowlist’ the necessary Google domains or disable the specific blocking feature while debugging.
#24. TikTok Pixel helper
This tip was added to this article on January 23rd, 2024. I guess that this is a temporary bug, and it might be fixed in the future, but right now, it looks like Tiktok Pixel Helper is preventing GTM preview mode from properly working. Disable that extension and see if it helps.
#25. Try remove the “Tag Assistant” Chrome extension
Even though Tag Asistant Chrome extension is designed to improve the GTM preview mode, some users started facing issues when the extension is active. For example, there have been reports that GTM preview mode works only on the 1st pageview. If you navigate to any next page, the preview mode disconnects.
If that sounds familiar, then try to remove the Tag Assistant extension and see if this helps.
#26. Using WordPress and logged in to the admin panel?
Some readers reported that GTM preview mode does not work if they are logged in to their WordPress admin panel. After they log out, things go back to normal. I could not replicate this issue lately, but if you are in a hopeless situation, this is worth a shot.
None of the tips worked?
First of all, read the comments below this blog post. People have shared more useful tips that might apply to you.
If none of those solutions helped you, please post a comment with the following information:
- A detailed explanation of what is not working. Some people report that they get a timeout, others say that they cannot see some events in the preview mode, etc. I need you to describe your situation in great detail
- Link to the website where this situation is happening
- Link to your preview mode. After you launch the preview mode, you are redirected to a tagassistant.google.com. When you enter your website’s URL and start previewing, copy the URL of that preview mode and share it in the comments. Don’t worry, if you publish the container at some point in the future, that shared preview mode will stop working.
GTM Preview Mode Not Working: Conclusion
Google Tag Manager’s preview mode allows you to browse a site where your container code is implemented as if the current container draft was deployed.
Is Google Tag Manager preview mode not working for you? In this blog post, I outlined a bunch of tips on how you can make the preview and debug mode start working right away – from checking your cookie settings to using Tag Assistant.
To recap, here are the most important takeaways from this guide:
- Browser extensions: Test in an Incognito/Private window. If it works, disable extensions one by one to find the culprit.
- Wrong container/workspace/environment: Double-check the GTM ID in the snippet vs. your GTM interface. If using Environments, make sure you’re using the correct preview method (“Preview” button vs. “Share Link”).
- Cache/cookies: Clear your browser cache and cookies, then try again. Completely restart your browser (not just close the window).
- GTM snippet: Verify the GTM snippet is present on the page (use DevTools Network tab, View Source) and hasn’t been modified.
If Google Tag Manager Preview mode is still not working for you (even after reading this blog post), post a comment below, and we’ll try to find a solution.
If you have already found a solution that is not mentioned here, please share it in the comments with others.
I have also published a post on the most common Google Tag Manager mistakes (some of which were mentioned in this post as well). I might save you some time in the future 🙂

172 COMMENTS
Turns out my problem was related to Cloudflare as this changed how the JS snippet was being pulled in. I changed to setting to optimise JavaScript and the preview mode started working.
Awesome tip! I'll include it in the blog post. Could you tell me where can I find this setting within CloudFlare (or what exact changes did you do)? Thanks!
I am using the W3ToalCache WordPress plugin and there is an integration with Cloudflare. The setting is within the W3ToalCache plugin in WP under extensions -> W3TC Settings -> Content Processing -> Then turn off "Rocket Loader". Having this setting on caused the GTM script to be surrounded in an alternative tag that affected the GTM preview mode. More information on this feature can be found here: https://support.cloudflare.com/hc/en-us/articles/200168056-What-does-Rocket-Loader-do-
Unfortunately I couldn't get rocket loader working in tandem with GTM by following their instructions as this should improve page performance. If anyone else can get it working I am sure it will help a lot of people.
Thanks! This is incredibly helpful. I'll update the blog post asap.
I had no idea gtag.js and gtm.js are different things. I was thinking that since I had gtag.js installed, it was Google Tag Manager as well. And for a whole day I was troubleshooting why debugging preview mode wasn't working until I understood that I had to install GTM myself... Maybe that helps someone else as well.
Will preview mode work on a site that requires log in?
Yes
I had a case where the problem was in the GTM code, which was not written in the HTML file but in another js file called in the HEAD, was solved by removing the GTM code from the JS file and pasting in HTML file
Hello!
In the new version, not a single one of my gtm.clicks are showing up in the preview/debug mode. Is is also happenning to anyone else? And how can it be solved?
Thank you!
Hi, do you have at least one All element clicks trigger enabled on a page?
Hello. Yes, I have all of them enabled actually. I just realized that none of them work on preview mode, then only work when published. Unfortunately, I’m not being able to test anything, just publishing :(
Same issue here
Can you share the link to your preview and debug mode and the website where this is happening? GTM team cannot replicate this issue hence it's difficult to fix it.
Same issue here. No tag fires in preview mode. The output in the preview window is "No tags were evaluated in this container". I have various pageviews, clicks, etc in my GTM container and none are visibly firing when testing using the preview mode. This appears to be a bug with GTM.
Hi, I have updated the guide with an additional tip that might help you solve the problem.
Hi Julius,
I have tried 6 x other sites and they are fine, it seems to be just one. I have quite a few tags and triggers in the container. It is using latest GTM4WP plugin, and tried with and without debug url but still disconnects after a few seconds, i also have Adswerve turned off.
https://tagassistant.google.com/?cb=8055371684657917&waffles#!#source=TAG_MANAGER&id=GTM-WDT8L3T>m_auth=MEsI_nC-QTLmgVE0FWfT7Q>m_preview=env-6
Hi, try now. Also, I have updated this blog post with more tips.
#12 - If you are testing more than one page/URL, close all of the windows except Tag Manager and start over by clicking preview.
For me, I got the preview connected once, and then when I changed to check different pages/URLs, I kept getting a "Not connected" error on the website page and on the "Preview" page. Starting over resolved it.
thanks Gord - that worked for me - I had too many versions of the URL open. Once I shut them all down and then launched the debugger it connected and worked perfectly
I have another issue.
Don't know why, but now I have debugger popup with "No debugger found" on several pages - including this - and can't get rid of it (obviously, debugging is disabled and no domains listed in debugger).
Hi, read this to resolve the issue https://www.analyticsmania.com/post/4-ways-how-to-turn-off-google-tag-manager-debug-mode/
Every time I go to a subdomain the debugger drops the connection. The GTM pixel is installed and works across both properties, but when I click on a link that takes me to the subdomain it drops.
I did get the debugger to stay open once using Gord Marwicks' suggestion.
Hey, Rob, I wanted to ask for more details:
1. Did you close all windows and tabs (even non-GTM related)?
2. Or did you close just all the preview tabs and website debugging windows? (while keeping other non-related tabs/windows open.
Which option did work for you?
I had two Chrome Browser windows open to tab back and forth but removed all tag assistant related materials and left other Google items like GTM, Analytics, etc. open. And, other tabs open that were unrelated.
The one and only time it worked for me I only removed the Tag Assistant windows and the website I was debugging. Sadly, I could not repeat the success by trying that again and ran into the same roadblock.
Please feel free to reach me directly through email. Happy to screen share and troubleshoot together. Then hopefully present a solution for another item above.
In my case, I am dynamically loading the Gtm snippet, which was working fine with the previous preview mode in GTM. Now it shows "Tag Assistant could not connect to a tag on". I checked all the steps as mentioned by you, the only thing that works when i add gtm snippet manually in , but does not work when dynamically loaded.
I found a solution to it, but it's more of luck and doesn't know why exactly the previous thing not working. The project is built on react and in the index.js file i was calling the function that loads GTM scripts in head and body as provided by GTM. So, this time I tried using a library react-gtm-module that loads the GTM script and it works as expected.
Still figuring out why the previous case didn't work, will update as soon as find any answer about it.
Just tried removing tag assistant plugin from browser, its now working for me
The page will open in new window but you can see the timeout issue will be no more
©2020 Google
Thanks for this article.
In my case it was the "Avira Save Shopping" PlugIn in chrome browser which came with my Avira Antivirus installation. After removing this plugin everything worked fine.
Hi Julius,
Nice info all step have checked but still, my debug mode is not working if my site doesn't have an SSL certificate is this issue or not.
thanks
Hi so this is crazy what Google did. Nothing works.
Right now I am able click PREVIEW in GTM, and then Tag Assistant window shows connceted to Container. The web page also says debugger is connected. However, when I look at the tag assistant window, it says:
"GTM-XXXXX is not enabled for debug"
To start debugging this container:
Go to Tag Manager
Open container GTM-XXXXX
Click the Preview button
Start new debug session
Which is exactly the thing I did so I am in this endless loop of broken!! Any ideas why?
If you see this, you need to select the correct GTM container in the top left corner of the debugger.
I have a website which takes the customer information from x domain and populates the domin y with that information in the form. However if i give doain x url in the preview mode gtm gets disconnected as soon as it goes to domain y..the other thing i tried was using domain y url,, but in that case the form is empty since the information is lost when gtm reloads the page...any solution to the problem..
Every time I enter my domain for debugger mode, Google states it could not connect and the pop-up window shows a different website extension and previous a different website than mine. My website is https://www.xxxxx.com and it continuously changes it to https://www.xxxx.co.za and shows the wrong website in the preview. I have confirmed multiple times that I am entering it correctly and on the preliminary screens prior to the preview pop-up, the domain is correct. I have also tried to add a trailing slash and removing the debug signal in the URL. I am at a loss.
Hi, please share the URL to your preview mode and the URL of the domain that you enter in the preview mode.
https://tagassistant.google.com/?cb=5204809633310215#!#source=TAG_MANAGER&id=GTM-KNV4S3R>m_auth=QG-qnhTlMI9FlDygdzPMnQ>m_preview=env-8
https://www.redshedbrewing.com
Hi, as it was already mentioned in the guide, you must publish your container. Currently, it returns 404 error, which means that it is not published.
Hey guys, Im using a subdomain to qa and sometimes it shows connected but the windows in tag assistant never loads, this is the preview link: https://tagassistant.google.com/?waffles#source=TAG_MANAGER&id=GTM-5JRBXXZ>m_auth=gxXxHSZuE4p-lcyL-_sI6g>m_preview=env-3&url=https%3A%2F%2Fhomolog.sempreemcasa.dev
Hi, read the latest tip in the blog post (where I mention environments). I know that the symptoms of your issue look a bit different. But still, check that you are enabling the preview mode for the environment correctly (not via PREVIEW button but via Admin > Environments > Share Link)
This new tip certainly solved it in my case (mentioned above) - thank you!
The only thing that isn't clear is how you test changes *before* having to push them live to an environment - because what you describe previews a specific environment, which works well, but I'd like to test stuff before having to push it live (like we could with the old tool)
Hi Julius,
You are a hero for updating this article so fast after releasing the new debug design. I really like the update and I've worked with it for a couple days. However, since yesterday it suddenly stopped working.
I've tried all the above mentioned possible solutions, however, none of them works for me.
If I click preview in GTM I am redirected to tagassistant.google.com. There I type out the right website, and click "Start". The website opens and the bar goes halfway and stops there. Stays there for around 20 seconds and then says "Tag Assistant could not connect to a tag on http://eagledev.leadingcourses.com/en". However, in the tab with the new link opened I get the small screen in the right bottom saying that it is connected to the debugger with a specific emoji, and sometimes it says it could not find the debugger. However, in both cases the debugger on tagassistant.google.com is not working.
Some additional info: We are currently building a new website and I have Tag Manager installed on both the new and the old website. On the old website it works perfectly fine.
This is the URL to the debug session:
https://tagassistant.google.com/#url=http%3A%2F%2Feagledev.leadingcourses.com%2Fen
Hope you can help me!
Please provide the FULL url of the preview mode. This means that you must try to enable the preview mode (even if it fails) and copy that URL. It will contain many parameters.
This might be needed as well:
https://tagassistant.google.com/?waffles#source=TAG_MANAGER&id=GTM-55X4K6N>m_auth=Dhba_Ju9qjCJbRpulyHehA>m_preview=env-2&url=https%3A%2F%2Feagle.leadingcourses.com%2Fen
You are using the environment snippet. This is the error that I see (right-click on the image below and click "Open in new tab"):
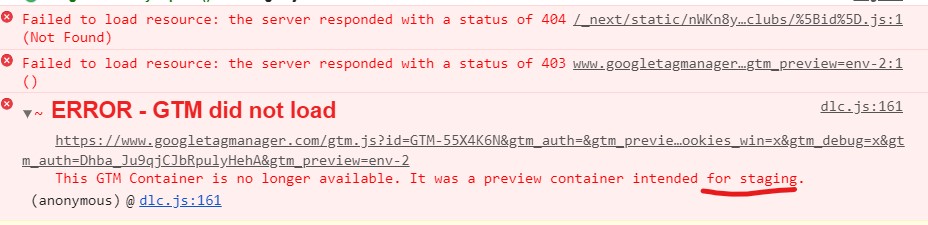

Follow the latest tip added to the guide.
Hero! I asked a developer to change to the default GTM snippet. How did you get to these insights. Are you using an extension for this? If so, which extension? How can I replicate this?
No extension. Just need to look at the code.
Hi Julius
The problem I'm having is that the GTM container sometimes loads and other times (at random) just doesn't. SO sometimes I see Message - DOM Ready - Window Loaded, but no container to fire the tags.
Any idea what could be happening here?
This is the preview URL: https://tagassistant.google.com/?cb=847854266750625#!#source=TAG_MANAGER&id=GTM-K3SLH5B>m_auth=HTCLZSisM80DdmjXCyEO2A>m_preview=env-6
Hi, What is the website URL?
Hi Julius, the URL is https:///www.amelior.be
You don't have Google Tag Manager on that website. That's why it's not working.
Hmmm weird. According to Google Tag Assistant and the 'Network' from the DevTools the container is added to the website... . I'll have to dig in deeper then. Thanks!
I just realized that I have to accept tracking to see the GTM container on a page.
So once I accept the tracking and then I try to enable the preview mode, it works just fine for me on your website.
I'm looking into solution #13. Where can I find the cookie named _TAG_ASSISTANT? I don't see it on several websites (including this one) if I check the cookies being set. How can I check if this cookie is being set or blocked?
You must go to the developer tools > Application > Cookies > your domain > and enter the cookie name in the search field.
If you don't find the cookie, it is not stored. I don't know how to check if something is blocking the cookie from being set. But if you have something like a cookie consent popup on a website and autoblocking feature enabled, most likely, that is causing the trouble.
Ah, I see. I must first activate the preview window. You're right, the cookie is not being set.
Autoblocking seems not to be enabled in this case (and Cookiebot is not yet configured so doesn't block anything yet, I would think).
But this does bring me a bit further. Something is blocking the cookie to be set. Now to find out what...
Thanks!
I read 3 google support forums and 2 other articles before stumbling upon this one --- crazy stressed I couldn't figure out why it said my tag wasn't on my site when it definitely was.
It was #5!!!! So simple and yet no one said to make sure it got done.
THANK YOU!!! Downloading your GTM guide ASAP!
Hi Julious,
My site is created by using SINGLE PAGE APPLICATION. With this new version of the preview mode, Page views are NOT captured when I navigate between pages. Hence, I see all events grouped in one single page container.
The developer that is helping me suggested to use 'History Change' as an alternative for 'Page View' as trigger. Now I can see the tags firing when I visit specific pages, but they are still grouped under the same Page container. This is not ideal.
Do you have any other idea to make Preview Mode work in this kind of sites?
URL here: https://tagassistant.google.com/#url=https%3A%2F%2Fwww.flip.co.nz%2F%3Fgtm_debug%3Dx
This is how single page applications work. And the new preview mode has nothing to do with it. The previous version worked the same way. When you navigate between pages, the URL is dynamically changed and everything appears under the same "page" in the preview mode. Just switch between History events and see how tags are firing.
Thanks! Had to go through all options to finally found out I had an extension called Disconnect which I forgot I had installed blocking it. Clicking "Unblock tracking" solved it. So if you're using this extension make sure it's allowing tracking on your website :)
Possibly simplistic but it worked for me. Use Google Chrome as your browser, not Safari (for sure, possibly others). Hitting preview (in Safari) ran code but nothing happened, no window pop-ups etc. EVENTUALLY, I tried it in Chrome and it worked first time! Doh!
O`key guys! I found 1 way, spend on it solve 2 hours!
If you have Tag Assistant - do the connection to site, and when you see "Couldn't connect to.... and No debugger found" just RESTART (refresh) tag assistant on a page site.com/?gtm_debug=x, and you will see the effect! Good luck!
Hi All,
I hope this comment will help some of you. It might be related to the comment made by Akim1337.
In short I couldn't preview my newly created and published container with a working tag (confirmed through GA dashboard) as I kept receiving "timeout" error in the Tag Assistant page and "no debugger found" in the previewed page. I believe I tried everything from the list in this post and please forgive me if my solution is there and I somehow missed it.
So solution first:
Remove Google Tag Assistant Extension from Chrome Extensions (disabling might help as well)
A bit more about the problem:
1. The new container features GA4 tags only
2. Container was implemented correctly and published with a basic Page View GA4 Event tag in it (I took a leap of faith not being able to test the first tag) - data flew to the property whcih I cinfirmed in Real Time report.
3. Any attempt to use Preview ended up with "0 container found" and "timeout" error in the tag assistant page and with "no debugger found" in the previewed page
4. Preview worked completely fine with other containers that contained GA3 tags
5. When Tag Assitant launched after hitting Preview button - the URL field just above the Start button was not populated with the URL of the page I was trying to test (which was the case for all the other containers)
All in all our IT suggested disabling all the extensions one by one and checking after each step if it has fixed the problem or not.
It worked after disabling Google Tag Assistant. If you have any suggestions for me to try and debug it further please let me know. Perhaps I missed some steps that would show it's a red herring - I am happy to help :)
Hi All,
Recently I had the most confusing experience, we were using zones to load containers in different apps and we also have a custom javascript variable to control what analytics property should receive the data, but because we had a zone restriction no tag was firing so if you are using zones make sure to check the zone restrictions because the assistant won't tell you if the tags did not fire because of zone restrictions
Another thing to try - this may just be coincidence - log out of admin on your Wordpress site. I kept getting "can't connect" errors whilst I was logged in as an admin. I logged out and it was ok connecting. May be coincidence.
Every time I visit to a new page on my website a new google tag manager installation appears on my Google Tag Assistant Chrome Extension.
I have not encountered this before. I am not sure what is going on. Has anyone else seen this?
Read this https://www.analyticsmania.com/post/multiple-installations-of-google-tag-manager-detected/
Great post! I ran into the timeout problem described by several people in the comments. For me, the culprit was the DuckDuckGo privacy extension in Chrome. I disabled it and things worked as expected.
Hello. In my case with the GTM preview mode ON, it shows events in this GTM window (precisely in the GA4 container next to UA container) but not in Analytics GA4 DebugView
Hi, sometimes debugview has some delays. Also, make. Sure you have selected the correct device in it.
Just spent a fair bit of time reading through a few of your troubleshooting guides but haven't solved my problem yet. I have a site (and due to some nondisclosure, I can't link you) where we have GTM installed (I've checked for punctuation problems, looks fine), GA tracking installed in the GTM container, plus some other tags. No environments, nothing fancy on the GTM side. I am getting the "Message" instead of "Container Loaded" thing you describe here: https://www.analyticsmania.com/post/pageview-trigger-not-working-in-google-tag-manager/ but the solutions there have not resolved this issue. I AM pretty sure at this point that the data layer is broken in some fashion, but can't be certain.
The really weird thing here is that while I can't get Preview to even show me a container load, Analytics is reporting plenty of visits (albeit significant losses, without recovery, after a new site design launched in 10/2020). Clearly the GTM container is loading for SOME users, but not in Preview. I am also pretty sure that my visits are not being recorded in Analytics, ie this container isn't loading tags for me, ever, in Preview or just browsing.
Right now I'm trying to get someone to look at the data layer, which is way outside my area of expertise (I'm an SEO and Analytics person, but I don't use GTM terribly often and I'm not a coder), whether there might be CDN issues involved, and review an age-gate popup to see if that's blocking cookies being set.
Do you have any other suggestions or things I should be looking at?
Update: there is no CDN involved, so that is not the issue. Developers are looking into data layer or cookie-based issues.
I was having issues getting the new preview to work in GTM. I still had the old Google Chrome Tag Assistant Chrome Extension installed the website would not connect in GTM until I clicked the Chrome extension to enable that. Then the site would connect with the new GTM preview.
Once I removed the GTM Tag Assistant Chrome extension the GTM preview connected to site right away. It seems that extension no being enabled on the page was causing the GTM preview to not connect.
Hi, I have a single page application. With GA4 the page views are firing on some of the pages and then suddenly stop tracking at the last 2 steps of the checkout. I am using a nuxtRoute event trigger of a history event trigger. Nothing works. Any ideas. I also dont see anything else load into the GTM tag assistant.
I've resolved the issue. In the GA4 admin interface on web streams details. There is an enhanced measures option. If you go into this and show advanced measures on page views you can untick Page changes based on browser history events, which stops another history event firing. This appears as event gtm.historyChange-v2
Same problem as many here.
GTM's preview mode isn't updating tags and triggers unless the container is published as mentioned in solution #10
Another issue I have, is that everything is delayed: the same values for click classes sometimes appear and sometimes don't. The same goes for firing tags and triggers which appear with the red X cross (when checking variables in the preview mode) and a bit later the green mark appears.
Worse, sometimes a tag that was working fine then stops firing when used a minute later then works (back and forth). Isn’t this going to mess up my analytics ?
This is very confusing as I can spend time trying to fix an issue that actually wasn't one. What is this?
Thank you for your help.
Hi, please share the link to your preview mode and describe what exactly does not work in it. I will take a quick look.
Thank you very much Julius.
Here are the share image buttons i'm tracking that are firing occasionnaly:
https://prnt.sc/xn4v79
here one of the tags fired: http://prnt.sc/xn59zg
Click Classes or preview mode are not "not working". It's just the way how those buttons are coded. Sometimes you click on a background of a button, sometimes on an icon. Thus you get different click classes. So the Preview mode works fine. You need to go more advanced with your click tracking or include additional conditions. Some additional tips https://www.analyticsmania.com/post/google-tag-manager-click-tracking/#css-selectors
Thank you very much !
Totally agree with the advice about Brave. I switched from Chrome to Brave a few weeks back because of the privacy issues. Quite happy with that. However yesterday I tried to test my various tags via GTM and Tag Assistant in Brave, and had huge issues. After trying Brave with shields down and various other work arounds, no joy. So, I went back to Chrome to do the GTM work, and all just fine. So, message is same as Julius's recommendation. Avoid Brave for any GTM work.
Great! My container wasn't published. Thank you.
Hi. Great post! Just wanted to share what I found.
After running through everything on this troubleshooting list, I finally figured out my connection issue was due to the Edge browser (Version 88.0.705.56 (Official build) (64-bit).
This morning, I woke up and thought to give Chrome a shot. Bingo!
For both Edge and Chrome and I have the same extensions running.
Hope this helps someone.
Thanks for this resource!
Actually, it was due to being logged into WordPress in the same browser. As soon as I logged out of the WP Dashboard, the debugger was able to connect.
Sites can block GTM or other unknown js scripts from running via content security policy (CSP).
if you've followed all the steps and still aren't able to see GTM/preview mode work, ask your devs/webmaster/IT team whether or not your site has a CSP implemented.
if so, the following values may need to be added to the CSP properties:
script-src: 'unsafe-inline' https://www.googletagmanager.com
img-src: www.googletagmanager.com
and to enable preview mode, some further CSP properties need the following domains added:
script-src: https://tagmanager.google.com
style-src: https://tagmanager.google.com https://fonts.googleapis.com
img-src: https://ssl.gstatic.com https://www.gstatic.com
font-src: https://fonts.gstatic.com data:
Thanks, I'll update the post.
I'll add another unexpected preview mode blocker...
If you're using Windscribe VPN's Chrome extension, it will somehow block the preview mode and cause a timeout error.
Thank You Mate! Really Appreciated.
Use two tabs to make it work. two separate windows of for example localhost:3000, while connecting to tag assistant.
Solution if none of the above worked!
Using Chrome Browser, check your Chrome Extensions. I removed any unnecessary extensions, including DuckDuckGo Privacy, EPUB Reader, McAfee and a few more and now it's connecting. So I'd suggest looking through chrome://extensions/ and seeing what you can remove to test it out.
Preview mode didn't work until I activated Tag Assistant Companion
Good luck!!
(sorry if it's repeated)
My solution is to run VPN (for example in Opera). None solution in this article did not work for me. But VPN helped to connect to gtm.
Hello,
I'm a beginner in Google Analytics and Google Tag Manager, and I religiously followed the steps in your "How to Install Google Analytics 4 (with Google Tag Manager)" Youtube tutorial. But, when I click Preview, type the website URL, it shows "Not Connected" on top of the domain name on the upper left corner of the page, and below it, "0 Google containers found". On the pop-up, it says "Could not connect to the *domain name* and "Tag Assistant could not connect to a tag on *website url* - Retry button - "A timeout occurred while attempting to connect. Check that the page is tagged correctly and no errors have occurred." I tried the solutions listed here, except for #15 as I cannot comprehend how to do it, how to find the GTM code, and afraid that I might make a significant change to the website. Please help! Thank you so much.
Please share the link to your preview mode.
Hello Julius,
I'm so glad to hear back from you!
Here's the link once I click "Preview":
https://tagassistant.google.com/#/source=TAG_MANAGER&id=GTM-WD6P9QH>m_auth=3z0XWTC8CD6F4ZXO8DAHfQ>m_preview=env-4&cb=233945431905323
Here's the link after I type our website URL and begin the preview where the pop-up says it can't connect:
https://tagassistant.google.com/#/source=TAG_MANAGER&id=GTM-WD6P9QH>m_auth=3z0XWTC8CD6F4ZXO8DAHfQ>m_preview=env-4&cb=233945431905323
And finally, here's the link on the website that was launched from the preview function:
https://vancillary.com/?gtm_debug=x
Many thanks!
I hope it's okay that I've posted the links here. If it exposes us to anything or anyone that would mess up our website or get access without permission, would you be kind enough to delete my comment once you've checked on the links? I'd really appreciate it!
It's the first reason of my blog post. GTM container code is not added to your website. We are not talking here about the GA code. It's GTM code that's missing.
For me it worked by simply using Google Chrome instead of Firefox. Funny how I needed to google my issue before even thinking about that solution, but then again, why the hell shouldn't it work in Firefox *drunk smiley*.
Seriously need some help! I'm working on this website https://[REDACTED].com/ and I've put in the GTM tag using headers and footers wordpress plugin. When I try to use preview mode it opens in a new tab (which is an improvement because last week it was opening in a new window). But the preview mode badge after trying to connect says "No debugger found." The tag assistant page says "Tag Assistant could not connect to a tag" and "A timeout occurred while attempting to connect." I have checked using the legacy tag assistant extension that the overall GTM tag is there (although I still don't see my tags & triggers firing).
https://tagassistant.google.com/#/source=TAG_MANAGER&id=GTM-5DB2LP4>m_auth=28vEPnx1MoQvdvXzEjs_Xg>m_preview=env-5&cb=4868435366233155
Just tried to use your preview mode's link and everything works fine. Try using the Tag assistant companion extension instead and uninstall the Legacy Tag Assistant. Also, try using the preview mode in Incognito mode in Chrome. If it works, the problem is in one of your Chrome extensions. You will have to figure out on your own, which extension is causing this. Disable them one by one.
"uninstall the Legacy Tag Assistant"
Can confirm. This fixed my problem.
Seems like even deactivated Legacy Tag Assistant interfere with the process.
Greetings again! Please ignore my last post - after several hours of connectivity, started testing some existing tags and within minutes, got dropped.
So I'm back to the community - what's happening here?
Tom
Hi,
For me, what solved the problem was disabling the Tag Assistant extension on my Chrome browser.
After being so desperate for a solution, I just tried randomly(ish) "solutions" until I thought about it. Just that!
I hope it helps
Thanks for the many tutorials
Hi Julius
Thank you for the great post. I've tried your solutions, but none of them works for me. I'm trying to debug the site https://thehungerproject.se/ but it won't connect. Could you please take a look?
This is the tag assistant-link: https://tagassistant.google.com/#/source=TAG_MANAGER&id=GTM-P97SV3D>m_auth=QAsXFhoWGk2HYHw3IL6X6A>m_preview=env-8&cb=8561245460848193
Thank you.
Your preview mode is affected by your cookie consent mechanism. It blocks GTM unless a user agrees to be tracked. If you want the preview mode to work, you first have to accept cookies on your website's cookie banner.
Hi Julius
Aha, there's the problem. Now it works. Thank you!
Have a great day.
Hi Julius, I am facing an issue.
GTM tags are added in all the pages of the website. I added some tags and set the trigger on Thank You page.
So on preview mode when I do a test after all the steps and reach thank you page tags are not getting fired. The Thank you page remains for 10 sec and then take back to home page. Is this causing the issue. Because when I click on back button, it takes me again to thank you page and when I refresh the pages, tags got fired but now thank you page remains no taking back to home page.
Hope you understand the problem. I am not able to debug it.
Better you remove redirect from thank you page to Home page
Hi everyone. In my personal circumstances NOTHING here worked. On the brink of giving up, I then remembered I have the "Malwarebytes" extension installed on Chrome! That was blocking not only the Tag Assistant debugger, but also Google Analytics itself! (on the Site/page I was trying to debug).
Enabled / white-listed both on that Site in question... *bingo!* - it worked. MAN I lost several hours reaching this point...!!!
The Preview mode wasn't working for me. After some investigations, I found out that gtm.js was being blocked by the uBlock Origin Google Chrome extension which I had installed in my browser. After disabling this extension, the Preview mode works.
I have a single page website (react). For anyone using react / node.js or .net core, the languages are natively designed to prevent injection scripting (which GTM requires), so you should run the react module which solved the problem for me:
https://www.npmjs.com/package/react-gtm-module
@Suraj - running the module worked for you because react is designed to prevent injection for security.
Thanks for your help!
My Ghostery extension was the problem for me.
For me it started working as soon as I disabled Site Kit plugin (wordpress).
It worked on Wordpress when I logged out of my wordpress admin
Thank you. #1 worked for me. I can't get the preview to connect using GTM, but I can using the Tag Assistant plugin.
Thanks! I was trying everything to get it working and it was #8 for me.
Thank you, for me the issue was the extension "uBlock Origin". After disabling, it worked.
GTM Preview works for everything except for YouTube videos embedded in modal popups. Upon inspecting the popup, the GTM attributes are injected in the code, but "YouTube Video" does not display in the GTM summary pane when the video is played. This applies to Chrome and Firefox browsers.
SOLUTION:
In Firefox: When the GTM Preview is initiated, you must stay on the webpage tab and clicking to play the video must be the very first action, then "YouTube Video" will display in the GTM Summary pane. If you instead clicked the Tag Assistant window tab as your first action and then go back to the website tab to play the video it will not work; "YouTube Video" will not display in the GTM Summary pane. You will then have to start a new Preview session. Clicking to play the video must be the very first action after opening a Preview session. It also will not work if your first action in the Preview session is undocking the web page tab from the other tabs before clicking the video to play. The very first action when a Preview session is opened must be clicking the video to play After that, as long as you are in that same Preview session, you can click back and forth between tabs and undock tabs all you want and it will always work.
In Chrome: Have not found a way to get it to work in Chrome. It probably doesn't work, because when a Preview session is started the webpage by default automatically is undocked from the other tabs and opens in its own separate window.
It seems like the 2 things necessary for YouTube videos embedded in modal popups to display in the GTM Summary pane are: 1.) The very first action of a Preview session must be to click the video to play, and 2.) The tab with the webpage cannot be undocked from the other tabs in the session before the video has been clicked to play first.
Apologies if this question has been asked before (I'm time-poor and stressed to figure out a solution).
GTM Preview Mode works fine, yet when I test out a trigger on a website I'm working on by filling out my details and clicking the submit button on a form, it is sending through an actual form.
I thought preview mode didn't action anything in real-time?
Preview mode is designed to preview GTM container. But everything that is done on a website is done in real life. Every form submission counts.
Hey there! THANK YOU SO MUCH - I was having such a hard time getting mine to connect because of a "Timeout" issue between the two, and it still was not working after I whitelisted and paused GTM, the tagassistant, and my brothers' site through Ghostery - but I figured I'd try connecting in an incognito window because I have quite a few extensions, AND IT WORKED!!
EFFING MALWAREBYTES, MAN.
Within the Malwarebytes Browser Guard extension, I had to not only pause ad-blocking {that I didn't realize it was doing for me), but I had to pause ALL "Browser Guard" activity, and that finally helped.
Please mention this in the next update you do, I'd love for this to help someone ahead who's also using MalwareBytes Browser Guard extension.
Again, thank you.
Here's what worked for me: Export workspace, Import to new workspace, Delete original workspace. For whatever reason, GTM Preview just didn't like that workspace I was in but was fine with everything else.
Hi, i don't know if this falls into the category of Preview mode not working. I just got access to this GTM account. Tags and triggers are there=>https://tinyurl.com/yg65jexe
However, they don't appear in the preview mode. Only the Pageview tag works=> https://tinyurl.com/yjxppg5g
What's weird is that some do work and appear in GA... any idea? I also just created a quick trigger and its not showing up in the preview mode. thanks so much.
You are looking at Google Analytics debug view, not GTM. Choose the GTM container ID at the top of the preview mode. If you cannot see it, it means that your preview mode is not enabled. Then "preview not working" tips apply.
Hi there,
Thanks for the blog, but for me, it seems that my tags are working fine over on the preview mode but I can't see them on the live website. Even when I have already published the container. The GA pageview tag is working in preview mode but can't be seen on the live website.
Difficult to comment without seeing the actual setup. There might be some delay because of how your website caches JavaScript.
If you import the script with a dynamic import, the CSP will prevent the preview mode from working, but the browser will not warn you in the console.
See this page for CSP policy for GTM, GA, and other google products: https://developers.google.com/tag-platform/tag-manager/web/csp
Difficult to say without audinting your website and setup. Something is firing the tag twice. Or maybe you have hardcoded pixel too.
Hi Julius,
Thanks for such an extensive list of issues for GTM's preview & debug.
Wondering if you have come across this issue - "Not enough memory to open this page".
I kept getting it upon submitting a (few) form(s) for testing. I've tried both Chrome and MS Edge with the same outcome.
Haven't faced this before
I was using Safing's Portmaster and SPN, and that was blocking GTM and my connection was timing out.
Once I deactivated that, I was able to connect GTM and preview my container on the site.
Hi, the tag assistant correctly connects to and scans the website, but in google tag manager the status continues to state NOT CONNECTED. How can I resolve this?
I am having the same problem. Have you found a solution yet?
Same here. I've tried many ways that were written in this article but have yet to succeed. I've removed Google Tag Assistant Companion and Google Tag Legacy, but the result remains the same. Hope someone can help me.
I have had success in getting preview mode to connect via a a slight variation of suggestion #10 above: "Try publishing the container (even if the container is not new)". Just publishing my existing container did not allow me to connect, but when I tried making a simple change first -- like just changing the name of a tag -- and then publishing, that worked! Hope this helps someone!
Mine wasn't working because I had this installed: https://chrome.google.com/webstore/detail/tag-assistant-companion/jmekfmbnaedfebfnmakmokmlfpblbfdm?hl=en
Unbelievable! It took me hours to figure it out! Go figure!!!
GTM Tag Assistant Companion extension was the culprit! The one thing that is supposed to help in this situation is what was causing failure. Oddly enough, it was only an issue in one of my Chrome profiles. I ended up disabling all of the extensions and turned them back on 1 by 1 - found that GTM Tag Assistant was the trouble maker. I removed and reinstalled it from that particular Chrome profile and now everything is working as expected. So strange that none of the other profiles had this issue.
Hi Again. I installed Firefox on my PC and voila, it worked. I was using chrome. I still have 3 pages that are active and five that are not active. Any advice? Thank you
When debugging, my gtm displays: Google Tag: not found, and the debugging page does not display the tag assistant prompt window. Moreover, I found that this problem exists in several of my sites, but my colleagues can debug it successfully. . I read the reasons in your list: I closed all extensions except this debugging assistant; including the possible mistakes mentioned in your list, they do not exist. If there are mistakes, my colleague will definitely not be able to debug successfully. I switched from chrome to Edge and it still doesn't work. Please help me think about the reason. I've been searching in front of the computer for four or five hours. Only your article is more reliable. Google's official documents are simply useless. look.
Another two and a half hours of research, it’s a VPN problem, sure enough there is nothing new under the sun, your list is right
Hi Sine, could you explain more about how that was a VPN problem?
For me it was this bugger: NordVPN 'Web protection' under Threat protection.
Pause it to see if it works for you and if it does, turn it off:
https://prnt.sc/1fD6Mdjz4rHh
It also blocked chat widgets on websites by the way, which I had no idea off.
Julius, not sure if you're planning to extend this to issues with server-side GTM, but if so I just discovered that it requires three cookies to be written to your browser to enable preview mode.
If you don't have the URL for your site in the Admin settings of the Server Container, it won't write them and you won't see your requests in the debugger.
Ever since I had to reset my computer I've been unable to access GTM Preview mode for any of my accounts.
As best I can tell it's not dependent on: Wifi, browser type, browser login or extension installed. It seems to be something specific to the computer or how it's set up.
Any ideas would be greatly appreciated. I manage multiple GTM accounts and I'm running out of ideas to how to fix this.
- Confirmed that other people can access the Preview Mode(s) for all accounts
- Confirmed that I can access Preview mode on my phone using the wifi
If I try to use Preview Mode with Google Tag Assistant added I see the Google tag in the top "button" list but the number beside the message "Google tags found" is 0. I get the following message:
Google Tag: GTM-XXXX not found
Please verify that the tag:
Is installed on this page
Is not being blocked (by a browser extension or a consent dialog)
Without Google Tag Assistant:
There are currently no debuggable Google tags at that address. Please verify that:
There is a Google tag on the page.
The Google tag is not a legacy tag. Learn more
The Google tag is not being blocked, e.g. by a browser extension or a consent dialog.
Please check that the page is tagged correctly and try again. Learn more
Steps tried so far:
General:
- Paused VPN
- Turned on and off the computer (multiple times after trying different solutions)
- Tried turning off the firewall
- Tried switching my wifi network to a private or public network
GTM General:
- Tried turning off debug signals
- Tried on different accounts
Chrome:
- Turned on third party cookies (also tried with it off)
- Tried multiple Chrome browser logins (both before and after all steps below)
- Tried in Incognito mode
- Added all three sites (GTM, Preview page, and site page) to Ignore in Ghostery (and then turned off Ghostery)
- Uninstalled and installed Google Tag Assistant (from all browsers):
Edge
- Tried accessing Preview Mode with Edge both with and without Google Tag Assistant added, got the same results as Chrome
Hi Julius sir,
Greetings
I am one of the biggest fans. I always follow your blogs, they helped me everywhere. You are making the work so easy and accurate.
I have an issue related to GTM. My GTM preview window is not opening for my website. I have tried every possible way but did not get any solution. Please can you guide me?
Thanks in Advance
Julius your recent tip, #24, was a life saver! I just removed the tiktok pixel helper and the preview mode was working again. Thanks a lot!
Hi Sam, remove the tiktok pixel helper. it worked for me. Cheers
Whoa TikTok Pixel Helper is indeed causing an issue right now. This guide was very helpful!
Uninstalling the Tagasist plugin helps on Chrome in Edge, the same thing... so the Tagassist plugin is to blame
I had the problem with the TikTok helper as well. I needed to restart the browser after deleting the extension, before the changes had effect.
What works for me was the #24. TikTok Pixel helper. Thank you for your knownledge.
Hi, Our container's preview mode had been working well in the other day, but, suddenly, the preview mode is not working.
I see the new browser that is connected to GTM is popping up. but, the preview page isn't connected.
Removed Tag Assistant Companion extension. Works now.
I have attempted all the suggestions provided earlier, but I am still getting a "not connected" error.
https://tagassistant.google.com/#/?id=GTM-5NCLJXDQ&url=https%3A%2F%2Fibsedu.org%2F%3Fgtm_debug%3D1707122683170&source=TAG_MANAGER>m_auth=UxsXl7CS33UiFmKsQkHoBw>m_preview=env-3
Hi Julius,
I keep getting this error Debug window closed The connected debug window has been closed. To continue debugging, reopen the window.
I tried all the tips you gave, but nothing changed
https://tagassistant.google.com/#/?id=GTM-TG2ZJSP&url=https%3A%2F%2Fwedex.agency%2F%3Fgtm_debug%3D1709023569943&source=TAG_MANAGER>m_auth=ksBBcfBhQABEanePNo6GTg>m_preview=env-5
Hey Julius,
Google Tag Manager cannot connect to my website while running the preview mode.
I've explored the DevTools of Chrome Browser, as suggested, and under "Network" I can see that the gtm.js status is (blocked:other).
Does anybody know what's happening and what could be the cause?
https://tagassistant.google.com/#/?source=TAG_MANAGER&id=GTM-WKF5P3W>m_auth=nGX-Tz82-I_xUdyGui1yjQ>m_preview=env-4&cb=7128086998331535
Your browser or some extension is blocking it
I was hours trying to make it work. Finally I followed the advise from one user here: I deinstalled the Google Tag Manager Extensions for Chrome and it works now.
Nice that this old page still helps :-)
Thank you for your work, Julius!
You're genius. If I have any issues with tag manager or analytics, Only one solution comes to my mind that is analytics mania. From your blog I learnt alot. Thanks.
We had an implementation where the gtm.js script was proxied through server-side GTM on a different filename. This file threw a 502 error on Preview Mode after migrating from App Engine to Cloud Run.
We switched to Simo Ahava's template to proxy the GTM script and that solved the issue for us.
https://www.simoahava.com/analytics/custom-gtm-loader-server-side-tagging/
Hi Julius - I'm getting a "name not resolved" error when I check the console. Here's what comes up:
GET https://www.googletagmanager.com/gtag/js?id=G-NXNLE3FM31 net::ERR_NAME_NOT_RESOLVED
af @ addDomElements.js:56
(anonymous) @ addDocumentElements.js:45
pv @ addDocumentElements.js:40
gv @ addDocumentElements.js:385
gA @ addDocumentElements.js:436
of @ addDocumentElements.js:511
(anonymous) @ main.js:55
Promise.then (async)
(anonymous) @ main.js:51
Help?
It's okay. I resolved it by turning off my VPN.
Hi,
Do you know why when preview is first activated it fails with a 'not connected' error message but when I click 'open tag assistant' it refreshes and connects?
I've been through the points in the article but can't find anything related.
Thanks
I tried to use debug mode. The debug cannot connect. I have investigated further and found out the error A timeout error occurred while attempting to connect.
Also when I check on network in developer tool, it shows status blocked:csp
Any helps are very much appreciated.
None of these has worked with me, the solution to my problem was deleting the AMP extension in Wordpress, i think it was blocking the tag from working, and that took me a while to figure it out, so am sharing it if someone can find it helpful.
I can't thank you enough for this help article. It saved me hours of debugging and more than once!
When I go to preview mode, it tells my GTM tag is not found on the page. I am using Google Site Kit to set up my code, but I have also tried turning off that option in Google Site Kit and manually copying and pasting the code. Either way it doesn't work.
If I click on the installation instructions inside GTM and test my site from there, I get the green check mark showing that the tag is installed properly. In addition, if I view the source code, I can see that the code is there where it should be.
I do not have a VPN. I have accepted all cookies (the site has Termageddon cookie pop-up). I have turned off all of my chrome extensions.
The site does run through Cloudflare. I have turned off all of my WAF rules and whitelisted several Google IP addresses that were given to me by a developer friend who is a Cloudflare expert. I do not have rocket loader enabled.
I have restarted chrome (including an update to the latest version). I have re-published my container. I have deleted all cookies, etc.
I'm out of ideas, and it's incredibly frustrating. This works just fine on a couple of other sites I have in GTM. Any help that you might be able to give would be so, so appreciated!
The URL is https://dickenpto.com/?gtm_debug=1736458296762
Julius, here is one for you:
I use a single QA web/client GTM container for multiple domains (not using sGTM). Several of our domains have server-side GTM implemented and also 1st party proxy in place.
My GTM Debug was working on one sGTM domain with 1st party proxy but not the other two domains.
I looked for differences in the sGTM containers and noticed that the one that was working had a Web Container Client for my QA web/client container. I updated the other two domains and GTM Debug started working.
If you don't add a Web Container as a Client in the sGTM container for the QA web/client GTM container, the Debug will respond with "No Container ID found..."
Hi Julius, thank you so much for keeping this blog updated for so long. I have tried pretty much everything on your blog, however, my conversions still don't fire. below is a summary of the issue:
I'm trying to trigger conversions for my website on a form submission.
I have created a conversion linker tag as well as a tag for the form submission. The trigger configuration is set to fire conversions on the "thank you" page. However, whenever I test this, within the summary, only the conversion linker tag fires but the actual form submission conversion tag does not.
Please let me know how to sort this out/if you have further questions!
Really appreciate you! Thanks!
Sometimes, I notice that the preview mode is working and showing data, but in debug view in GA4 no events are shown unless I enable tag assistant, which then shows each event in every page view.
Hey Julius,
With reference to number 8 - I just had the same thing happen when I pasted some code in slack for a developer so this should be avoided too or else it will transform the code to using curly quotes.
Steve