
February 11, 2025
How to Debug iFrame with Google Tag Manager Preview Mode
In October of 2020, the team behind Google Tag Manager released a completely new version of Google Tag Manager preview mode. That was a necessary step in its evolution (because the industry is moving away from 3rd party cookies).
If you are new to the preview mode, read this blog post and watch this video tutorial.
Shortly after the launch, one of the main challenges with the new preview mode was the inability to debug iFrames. Luckily, the GTM team worked hard and eventually improved that part as well.
In this quick guide, I will show you how to debug iFrame with Google Tag Manager preview mode (the one that was released in 2020).

The Process
Here are the steps that we are going to complete (the order matters):
- Install the Chrome Extension
- Enable the preview mode on the parent page
- GTM preview mode will offer to enable the preview mode in the iFrame as well
If that does not work, we will manually enable the preview mode in the iFrame
Install a Chrome Extension
First, you should install the Google Tag Assistant Chrome Extension. It will add some improvements to the preview mode (e.g. opening websites in new tabs rather than new windows). Also, it will help with iFrame debugging.
You don’t have to turn it on (or anything else). Just have the extension installed on your browser.
Enable the preview mode on the parent page
In Google Tag Manager, open the container that you inserted in the iFrame and click the Preview button.

Enter the URL of the parent page and press Start. When the preview mode opens, you might see a notification offering you to enable GTM in the iFrame as well. Click Enable.

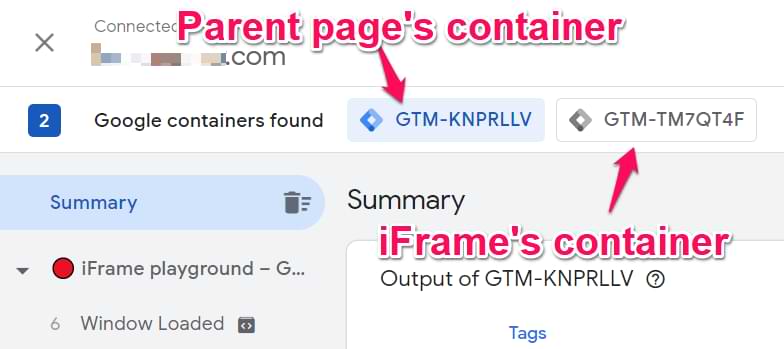
What will happen next is that you will see a new GTM container appear in the top bar. If you already saw it, then from this moment, it will start displaying events and data as well.
If you don’t see the offer to enable the preview mode in iFrame
In case you don’t see the aforementioned notification, here’s an alternative option on how you can enable the preview mode in the iFrame.
In Google Tag Manager, open the container that you inserted in the iFrame and click the Preview button.
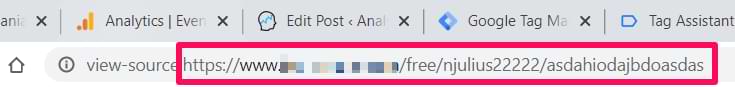
Enter the URL of the iFrame and press Start. Don’t know what is the URL of the iFrame? One of the ways is to do the right-click on the iframe’s background and select View Frame Source. When a new tab opens, you will see the URL of the iFrame. Copy it and paste in the Preview mode’s launch popup (just don’t paste the “view-source:”).
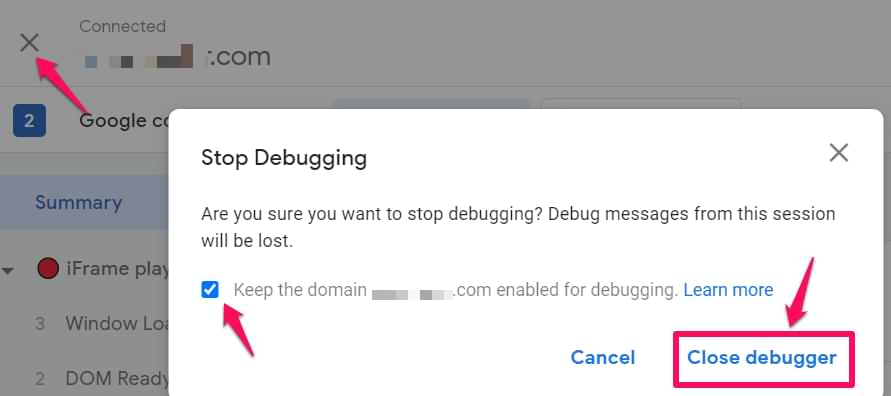
When you enable the preview mode, click the X icon in the top left corner. Then enable the checkbox Keep the domain XXXXX enabled for debugging and press Close Debugger.
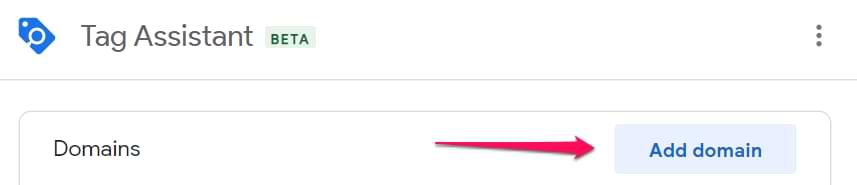
Then you need to enable the Preview mode on the parent page. If you are using the same container on the parent page and iframe, press Add Domain on tagassistant.google.com and enter the parent page’s domain.
If you are using different containers, then go to the container of the parent page (in the main GTM interface), press Preview, enter the parent page’s URL, and then hit Start.
Since preview mode is now enabled on both websites, then you should start seeing the data coming in from both websites.
If your iframe is on the same hostname as your parent page, there is no need to separately enable preview modes (because in the end, everything is happening on the same hostname).
Two separate containers vs one container
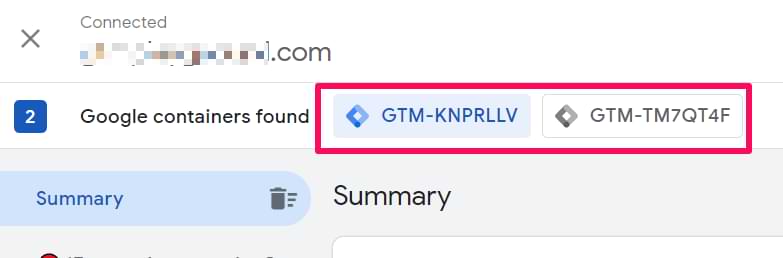
If you are using two distinct Google Tag Manager containers, don’t forget that you will have to switch between them in the preview and debug mode in order to see what is happening.
You can switch by clicking the container IDs here.
If you are using the same container on both pages (parent and iframe), then all of the events will be displayed in the same feed (but they will be grouped by pages).

Distinguish pageviews between the iframe and a parent page
That’s where another useful Google Tag Assistant (Chrome extension) feature comes in handy: emojis and shapes. When the Tag Assistant extension is installed, it adds a shape or an emoji to the debugger widget…
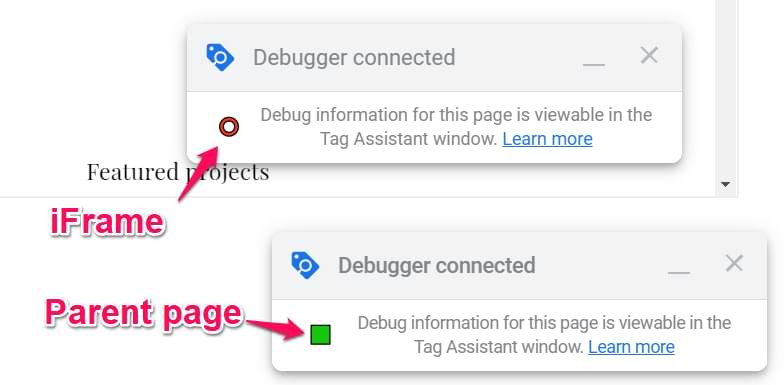
…and to Page titles in the preview mode:
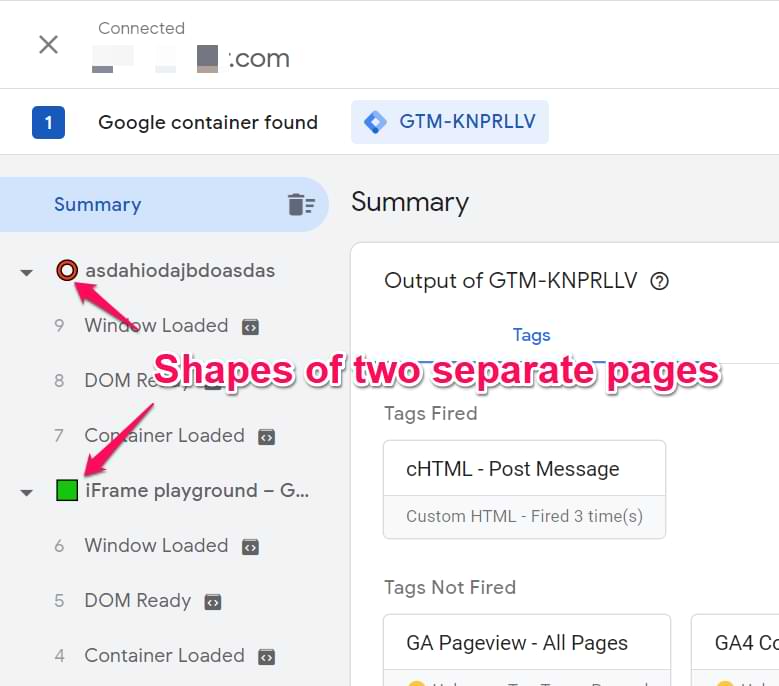
Thanks to that, you can easily distinguish to which page does that particular event belong. This is especially useful if you are working with a single container on a parent and a child page.
Ignore the flickering
At some point, you will notice that in the top-left corner of the preview and debug mode, the domain name is flickering every second. It will be switching between both domains (the parent domain and the iframe domain). This applies to situations when your iframe is on a different hostname/domain.
At the moment, that behavior is expected because the preview mode keeps getting signals from both domains, hence they are constantly switching.
Maybe in the future, this will change but at the moment, don’t worry. That’s just how it is displayed.
Is GTM preview mode not working?
If you are facing some issues with the preview mode, take a look at this troubleshooting guide.
Debug iFrame with Google Tag Manager: Final words
And that is how you debug iFrame with Google Tag Manager preview mode (I am talking about the new one). I’m glad to see that eventually, the GTM team updated their new feature and included the possibility to debug one of the most annoying things on the web 🙂
Got questions? The comments section is at your service.

6 COMMENTS
I'm not able to connect GTM to the iframe when entering the frame source URL. Tag Assistant says "could not connect" showing 0 Google containers found for the iframe URL. Even if I debug the parent container first, then try to load the iframe URL debug, it doesn't connect to the iframe.
For me this has always been the biggest limitation with GTM, and was really excited to see you post this. Any other ideas on how to get this to work?
Hello Julius,
Thanks for this article ! I have an iframe embeded in a third party domain. I implemented Google Analytics with GTM in the iframe.
When the iframe is loaded directly, the tracking is working correctly. But when it's loaded inside the external domain, I don't receive any data at all.
I tried to set "cookie_flags" to "samesite=none;secure", but it doesn't seem to change anything.
Any idea how to handle that ?
Hi Julius, I've searched high and low for any information but Tagmanager forum is full of similar questions, but 0 answers. Wondering if you know what the issue might be?
I'm tracking conversions for Google Ads campaign via GTM. Conversion linker installed and firing. Tags are all firing (they are simple clicks/pageview tags, nothing fancy) and triggers working with green ticks. However the tag says "Google Ads Conversion Tracking - Failed", and all conversions I am seeing in Google Ads are "unverified" and "No recent conversions" (for "All pageviews" tag that I installed a while ago... still 0 conversions).
I checked and double checked the usual suspect like conversion IDs and Labels - they are correct and matching.
I have a bad feeling there is some issue connecting GTM to Google Ads. Is there anything I can do - like sequence of tags, forcing connection, etc?..
Could any specific features of the site prevent this connection to Google Ads?
Google analytics installation via GTM is working great though I've not got around to setting events at the moment, trying to sort out google ads tags.
Thank you
Please share the link to your preview and debug mode (and the url of your website)
Hi Julius, and thank you for this great article!
The GTM container in the IFrame works fine in preview mode, but it does not send any information in production. Is this because the IFrame is on a different domain than the parent site? Do I need to use postMessage API?
Thanks!
Guido
Theres a recurring pattern it seems where readers are able to get triggers/tags working when directly debugging the iframe link in preview mode. Yet, no tags/triggers work when attempting through an iframe from the parent website... This sounds like a problem for the postMessage API maybe, but I am not sure.
I am using CDM in my case, so only one container. I also can not get tags to fire through the iframe. When I try debugging, I can not reproduce the effect of having both containers loaded at the same time. For me, only the parent window's container loads.
Again, everything works when I visit the iframe link directly for debug. But, through an iframe, nothing works.