
October 28, 2025
Google Analytics Real-time Reports Not Working? Here’s How To Fix It
Updated: October 28th, 2025
Here’s a situation. You have just set up Google Analytics tracking, opened GA Real-time reports, and nothing. You don’t see anything. No page views, no events, nothing. Sounds familiar? Relax. You’re not alone.
To save you (and others) some time, I’ve compiled a list of the most common mistakes in why Google Analytics real-time reports are not working. The most common reasons are active data filters (such as the internal traffic filter), browser extensions (such as ad blockers or privacy add-ons), or an unpublished Google Tag Manager container.
This guide provides a comprehensive checklist to help you diagnose and solve the exact cause of the problem, starting with the most common culprits.
Quick side note: if you’re also struggling with Google Tag Manager, check this list of the most common GTM mistakes.

Table of contents
– Hide table of contents –
- #1: Internal/developer filter is active
- #2: Maybe GA4 is not installed at all?
- #3: Opt-out extension is blocking GA4
- #4: Ad blocker is blocking Google Analytics
- #5. Google Analytics is blocked in developer tools
- #6. Google Tag Manager is blocked by an extension
- #7: Maybe you are checking the wrong GA4 property?
- #8: Some VPN providers block Google Analytics
- #9: Google Tag Manager is not published
- #10: Using Brave browser?
- #11: Content security policy is blocking GA (or GTM)
- #12: Very rare: Google Analytics is down
- #13. Consent
- #14. Comparisons
- #15. ga-disable-XXXXXX
- Final words
This list is growing based on your feedback
I keep updating this article based on what people share in communities, comments of this article, etc. So if none of the tips here helped you, please let me know in the comments. Describe your issue as detailed as possible. This might help me (or others) to troubleshoot the issue and then update this article accordingly.
Found a new reason/solution yourself? Please share it in the comments, too, and I will include that in the blog post.
Video tutorial
If you prefer video content, here’s a tutorial from my Youtube channel.
#1: Internal/developer filter is active
In Google Analytics 4, you can exclude your internal traffic (that is coming from your employees/coworkers). That feature checks the IP address of the visitor, and if it matches the rules of internal/developer traffic, your events will be excluded.
The first place to check is to go to Admin > Data settings > Data filters. If you see “Active” next to the Internal and Developer filters, this might be the reason.

But we are not done yet. In the Admin panel, go to Data Streams > Click your web stream > Configure Tag Settings > Show All > Define internal traffic.
This will open a list of rules that define internal/developer traffic.
- If you see no rules, your GA4 real-time reports don’t work for another reason (in that case, continue reading this blog post)
- If you see some rules, click them and see what IP addresses are configured there. If one of them is yours, that might be why you don’t see yourself in the real-time reports.
#2: Maybe GA4 is not installed at all?
Sometimes bad luck happens, and Google Analytics 4 might not be installed at all (or maybe developers accidentally removed it from the website without your knowledge?).
To help you verify that, I have prepared a list of ways how you can check if Google Analytics 4 is installed on a website. So go there, and read those tips.
If eventually, you find out that Google Analytics 4 is indeed not installed on your website, there are several ways to do install:
- You can install GA4 with Google Tag Manager
- You can install it with a native GA tracking code, known as GTAG
- Or maybe you are using a content management system that supports Google Analytics 4 integration (where you can just paste the GA4 measurement ID, and it will start collecting data). Wix is one of those examples.
If you have installed GA4 via Google Tag Manager, it would also be a good idea to check if GTM is still installed. You can learn that by watching this video.
#3: Opt-out extension is blocking GA4
Other options for website owners who want to exclude their internal traffic are the Google Analytics Opt-out add-on, Block yourself from analytics, or other browser extensions that tell the Google Analytics JavaScript not to send information to Google Analytics.
To start seeing your events in GA4 real-time reports, you’ll need to either temporarily remove the extension or disable it (depending on the extension’s functionality).
#4: Browser extension is blocking Google Analytics
There are even more browser extensions that can potentially block Google Analytics (which means that events of users using them will not be displayed in any GA4 reports, including real-time reports).
Examples of such extensions are Ghostery, AdGuard AdBlocker, and AdBlock Plus. So if you’re using one of the blockers, try disabling them and see whether it helped. Other plugins (reported by readers) are:
- DuckDuckGo privacy
- uBlock Origin
Sometimes, I have seen situations where a plugin (completely unrelated to privacy) interfered with GA or Google Tag Manager. So my tip here would be to disable all extensions in your browser, start enabling them one by one, and keep checking the real-time reports. Maybe at some point, you will start seeing your events there.
#5. Google Analytics is blocked in developer tools
It’s possible that while you were testing, you wanted to temporarily block the requests going to Google Analytics (but later forgot to unblock them).
If you open developer tools, check the requests that contain the word collect. If you have blocked requests to google-analytics.com (or some similar domain), an error message will look like this:

Why “collect”? This is the name of the endpoint (like a receiving address) that Google Analytics uses to receive tracking data. Seeing requests containing /collect confirms your browser is trying to send data to GA (unless you’re using server-side GTM. Then the endpoint can be custom, and it’s impossible for me to give you universal advice).
To unblock the request, right-click the request and then click “Unblock [domain]”.

#6. Google Tag Manager may be blocked by a browser extension
If Google Analytics 4 is installed via Google Tag Manager, then it’s possible that Google Tag Manager is blocked by some browser extension (e.g., uBlock origin, Ghostery, etc.).
You can open developer tools and look for the gtm.js request (if you are not some a very customized server-side tagging setup).
If the gtm.js request is blocked or redirected somewhere else, it’s probably because of some extension in your browser. You will have to disable them one by one to find out.

#7: Maybe you are checking the wrong GA4 property?
We’re all human, and sometimes, we make mistakes. One of the first things I would check is GA4 measurement ID. Are you looking at the correct Google Analytics 4 property?
Go to Admin > Data Streams and check the Measurement ID there. It starts with “G-”

Now check where your Google Analytics 4 is installed on a website (it might be a GTAG code snippet, installation with Google Tag Manager, or maybe your CMS has a dedicated field for Google Analytics ID (like Wix has). If they match, you’re good. If they don’t match, you’re looking at an incorrect property.
How to find the right property? That is not easy. When I write this blog post, the search in GA property picker (see the screenshot below) does not support GA4 measurement ID.

So you will need to manually check properties (and their data streams) one by one until you find the correct one.
#8: Some VPN providers block Google Analytics
If you use a VPN (e.g., Surfshark, ExpressVPN, etc.), they might also be blocking Google Analytics 4. For example, NordVPN offers Threat protection, which blocks Google Analytics. Also, one of the readers mentioned that the Windscribe VPN Chrome extension blocks Google Tag Manager, too (and this might also block GA4).
So if you are using these or other VPN tools, try to disable them (for testing) and see if Google Analytics 4 real-time reports start showing your own data.
#9: Google Tag Manager is not published
If you choose to install Google Analytics 4 via Google Tag Manager, you must ensure that changes in your container are published. Every time you change something in the GTM container and test it, you have to publish the container. Only then will these changes go live for your website visitors too.
Log in to your Google Tag Manager container > Overview and look at the Workspace changes.
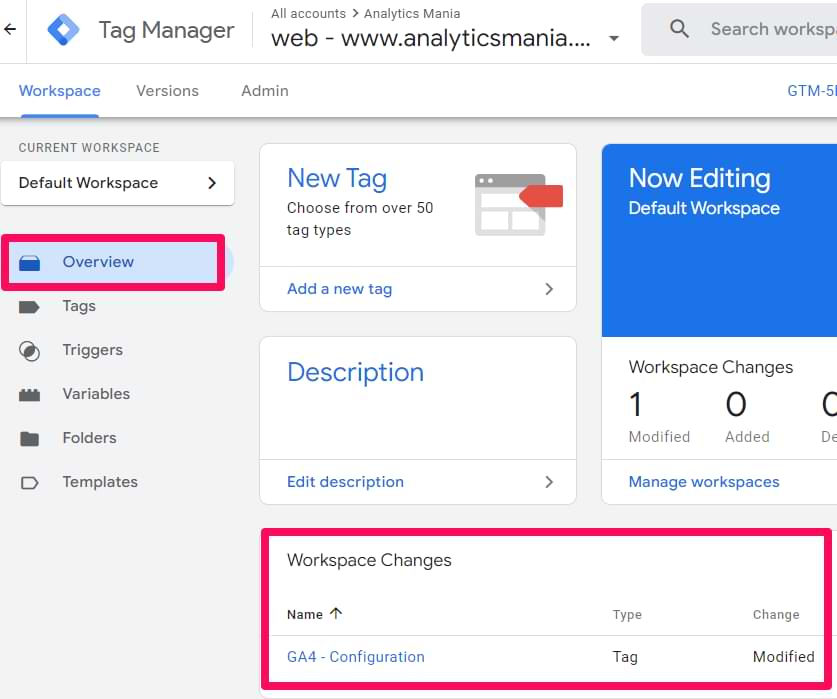
If you see anything there, those changes are not published. If you see a Google tag (a.k.a. Configuration tag), this might be why GA4 real-time reports are not working for you. Test that Google Tag Manager setup (with a preview mode) and then publish (by clicking the Submit button in the top-right corner).

#10: Using Brave browser?
Brave browser is known for blocking various endpoints related to Google. This includes Google Analytics, Google Ads, and Google Tag Manager. If Brave is your primary browser, you have two options when it comes to working with Google Analytics:
- Use a different browser while working with GA (e.g., Chrome or Edge)
- Or disable the main security feature of Brave browser called Shield
#11: Consent security policy is blocking GA (or GTM)
If your website has a Content Security Policy, it might block Google Analytics requests. You can identify this by going to your browser’s developer console (On Windows, Chrome, you should go to Browser’s Menu > More Tools > Developer Tools > Console).
Then refresh the page. If you can find an error that looks like this (or something similar), this means that you are dealing with the Content Security Policy.

But in this case, the URL of the error in the screenshot above should contain google-analytics.com.
What does that mean? Your developers will have to update the CSP of the website. There are no workarounds. You won’t avoid developers here. Here are the instructions on what they should do.
In 2022, Google changed the URL of where GA sends the data. Previously it was just www.google-analytics.com, now, it might be region1.google-analytics.com (or something similar). So it would be most convenient if developers updated the CSP to support all domains containing google-analytics.com.
This means that CSP should add *.google-analytics.com and *.analytics.google.com to their “connect-src” and “img-src” instructions in their content security policy (*. at the start is important).
#12: Very rare: Google Analytics is down
Even though this rarely happens, it’s still worth a shot to check. Sometimes Google also might have bad days that can disrupt Google Analytics. One of the first places where I would check is this status dashboard. See what’s the status of Google Analytics there.
Also, you can google “Google Analytics status” and check other search results.
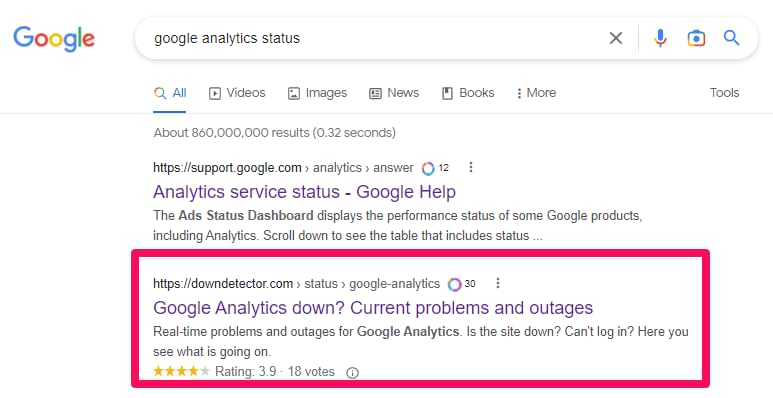
On some websites, people can vote/report if they are having issues. If you see multiple people reporting issues at the same time, there might be an outage that Google hasn’t publicly announced yet.
#13. Consent
This one is full of nuances, and, unfortunately, I will not be able to give you specific instructions (because the setup on every website can be different).
In a nutshell, the problem goes like this: check if you have a cookie consent popup on your website. What happens after you reject cookies in that popup? Normally, the Google Analytics 4 tracking code should not be activated, which means that Debugview will also not work.
Another situation might be that maybe you have implemented Advanced Google Consent Mode. If the visitor does not give consent for tracking, your GA4 tracking codes are still activated. However, then the data sent to Google Analytics 4 is limited, and you won’t see such events in the DebugView (it’s impossible to see them).
One more idea that comes to my mind is that maybe your cookie consent popup uses an auto-blocking feature that automatically blocks all tracking codes on the site and does not let them work properly.
How to troubleshoot this? It’s complicated. And as I have said, things can differ on various websites. To learn more about cookie consent popups and Google Consent Mode, take a look at my Google Tag Manager course for beginners.
#14. Comparisons
At the top of the real-time reports, you can filter down and see just a particular group of visitors. This is possible thanks to Comparisons. So, if you don’t see any traffic in your real-time reports, take a look here:

If it says “All users”, then you’re fine. The data of all visitors is displayed in the report. But if you see something else…
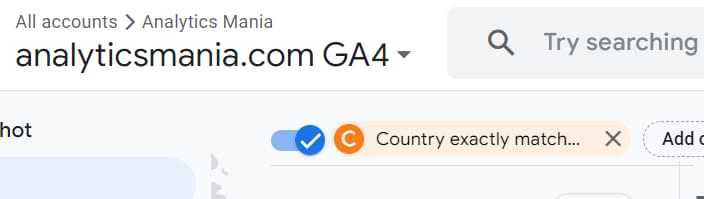
…then the report shows just part of the data. Maybe you used Comparisons in another standard report and later navigated to Real-time reports? Comparisons persist as you browse the “Reports” section.
If that’s your case, click the toggle switch or X in that comparison to remove it.
#15. ga-disable-XXXXXX
This reason happens rarely, but it’s still completely possible.
Check the source code of your website. For example, you can do that with a right-click on your page’s background > View page source. Search for “ga-disable”.

gtag.js library (used by Google Analytics) supports a feature that allows disabling Google Analytics on a page programmatically. This code is usually placed high in the source code, above gtag.js or the Google Tag Manager container snippet.
That feature looks like this:
window['ga-disable-GA_MEASUREMENT_ID'] = true;
GA_MEASURMENT_ID should be replaced with the ID that is used on your website, e.g., G-123456789, for example:
<script>
window['ga-disable-G-123456789'] = true;
</script>
<!-- Google tag (gtag.js) -->
<script async src="https://www.googletagmanager.com/gtag/js?id=G-123456"></script>
<script>
window.dataLayer = window.dataLayer || [];
function gtag(){dataLayer.push(arguments);}
gtag('js', new Date());

gtag('config', 'G-123456789');
</script>
If you found window[‘ga-disable-GA_MEASUREMENT_ID’] = true in your source code, that’s the reason why real time reports are not working. In fact, your Google Analytics shouldn’t work at all because this feature disables GA completely. What to do? Remove that line of code or ask the developer to do it.
This ga-disable flag is an official feature provided by Google. It’s primarily intended to be used as part of a custom opt-out mechanism for site visitors. For example, a website might set this flag to true via JavaScript if a visitor clicks an “Opt out of Analytics tracking” button, providing a way to respect user privacy choices directly within the site’s code, often in conjunction with cookie consent settings. However, if this code is present unconditionally on the page (perhaps left over from testing or implemented incorrectly), it will block GA4 entirely for everyone.
Google Analytics Real-time Reports Not Working: Final words
GA Real-time reports are a great feature that enables you to check if the data from your website is passed correctly to Google. However, sometimes analysts and marketers fall into a trap when tracking data (or a part of it) is missing.
There are many reasons why Google Analytics real-time reports might not work, and in this guide, I’ve listed the most common mistakes that can cause that. This list is far from complete (and I’m sure I’ll update it in the future), but these reasons are the ones I deal with the most often.
Did I miss anything? Do you have anything to add? I’d be more than happy to hear your thoughts/experiences.
20 COMMENTS
Great piece. Many thanks for posting. The Tag Assistant extension proved valuable.
I have a question.
when i start the preview mode in tag manager and then submit a form it does show in analytics, as an event, as well as a conversion.
But when i close the preview mode and submit a form it doesn't show in analytics.
Who can help me?
Hi, publish a container
Hi Julius, great work! I was very proud of myself these last few days when I created my first tags & triggers thanks to your online videos, thank you! Today though I realised mobile sessions are not being tracked. Do you have a specific solution for this? I went through the list but couldn't find it.
There is a chance that your mobile version does not have GTM installed. Consult with your developers about this.
Hi Julius,
I have a brain puzzle for you: we are tracking a "click URL" - a button on several pages, via an Analytics goal. We made sure the URL is the same on all pages. The problem: the goal is activated only upon clicking on some buttons, but not all. I.e. the one on the homepage does not trigger a goal, but the one on the HR page does, and so does the one on the News page. We verified how the goals are set up in UA, we checked the tag and trigger in GTM. We checked the setting you mention to see if anything was amiss. Nothing. We are lost. What could be the issue?
Difficult to tell without doing an audit. A support for this kind of scale of issue would be included if you enroll in my GTM courses https://www.analyticsmania.com/courses/
So my case is a bit crazy.
Normally real-time shows values between 200-400.
But for few times a day it dropt to values like 5-10.
It's hard to believe that our visitors stop their reading in certain hours.
Maybe something broke in your tracking code setup. Check that.
I read all your points, however, I couldn't figure out the problem in My website's GA 4. Can you assist me and tell me what is the actual problem why I can't see real time data?
I could try to assist if you could provide at least some information about your situation
Thank you for the response - the website is ipnr-endura.com I cannot track real-time data it's not showing. I removed the GA4 code and again implemented UA however, facing issues with real-time data. Hope you can help me.
Hi Julius!
Thank you very much for your useful articles. I was following the steps from this blog https://www.analyticsmania.com/post/how-to-exclude-internal-traffic-in-google-analytics-4/ as I wanted to define internal traffic. I published GTM container, GA4 is installed as Config tags are firing when i do testing in Preview in GTM, I could see my events in GA4 DebugView with developer traffic type. So everything seems to be working. The IP address for our office is the same, and it is a decent number of people who are using the website, so I would assume I should have had data in real-time reports. However, it still shows as "no data available". I go real-time reports --> build comparison --> choose "Test Data Filter Name" dimension --> and choose Internal traffic with excluded IP as a value.
Should I maybe be using a different Dimension name/Create one? From what I read, test data filter name is when you are testing, but now my filters are active. When I tested the filter, the data started showing up in real-time reports. However, as soon as I activated them, I have 0s.
I would really appreciate your advice here, as I felt stuck for couple of days already.
Thank you!
Thanks for help. I was getting internal erro while trying to look real time users. It was kaspersky blocking it and i allowed to the google to get info and it is now working without any problem.
Thank you.
Hi Julius, do you maybe have an idea why "Users by First user source" doesn't show anything in the Real time report, while everything else is working in Real time? Thx
My GA tracker is tracking my shop pages, but no other pages on my website. Any solutions?
Hi Julius,
thank you for the excellent article. I have a question. According to your video, I created a tag for tracking call clicks and successfully tested it in GTM. The tag was firing. But I don't see it in the event list in GA4. Then I found this article and turned off the internal traffic filter. But I still don't see the event there. Any idea? What could I have missed?
Thank you for your answer
I Tried everything here but still couldn't get my tracking to display. also checked the video. I am using WordPress with MonsterInsights so it authenticates everything via google login auth.
we are sending events from salesforce aure components.While i inpect events are showing from back of code while inspecting. but ga4 dashboard is empty even the active user is empty.script is loading i checked.even network it is 200 code .please help me on this.
Dear grateful and almighty Julius!
Thank for compiling this guide! I am experiencing a problem that I don't see covered anywhere: My Realtime Report is working ok, seems to collect all data, from various users.
But the problem is the Realtime USER SNAPSHOT! It is only clocking one action(page view or a scroll or user engagement), and nothing else! Event hough I am sure that visitors perform other actions. In Debug View I see it is collecting all the actions performed on the website! So I cannot figure what is the reason why I don't have Realtime User Snapshot collecting all the actions and what is the impact of this on the general reporting. Can you please share your thoughts on this?
GA4 Property is set ok, No content policy blockers. GA4 is added via GTM tag. The GTM is set so when I am testing it sends test traffic to another GA4 property when it detects debug mode. Otherwise for a normal non test/debug visit traffic is captured by the main property. The site has several sub-domains. These details are for extra context.
Thank you!