
January 3, 2026
Conversion rate in Google Analytics 4
Updated: January 3rd, 2026
Important: Conversion rate has been renamed to Key event rate. You can learn more about it here.
=====
When Google Analytics 4 was introduced, it was missing one very important metric many people relied on in GA3, conversion rate (CR).
Even though we could see the total number of conversions, that was not enough (because the CR allowed us to see the percentage of sessions performing well).
In Google Analytics 4, a key event (formerly known as “conversion”) is any user interaction you’ve marked as important to your business, such as a purchase or lead submission. To measure the effectiveness of these actions, GA4 provides two primary metrics: session key event rate and user key event rate.
Session key event rate tells you the percentage of sessions that contained a key event, while user key event rate tells you the percentage of users who triggered a key event. In this blog post, I will explain how each metric is calculated and where to find them in your GA4 reports.
Table of contents
– Hide table of contents –
- What is conversion?
- What is the conversion rate?
- Two types of CR in Google Analytics 4
- Standard GA4 reports
- How to analyze conversion rates with custom reports (explorations)?
- Ecommerce conversion rate
- Final words
Video tutorial
If you prefer video content, here’s a tutorial from my YouTube channel.
What is conversion?
A conversion is an important action a visitor/user completes on a site/app. The most popular example is a purchase. Most businesses exist to serve their customers (hopefully) and generate revenue. Therefore, their goal is to generate as many sales (purchases) as possible.
If a company wants to measure its success, it has to measure purchases as conversions.
Other examples of conversions can be (but don’t limit yourself just to these):
- When someone signs up for a webinar
- When someone subscribes to a newsletter
It is important to remember that Google Analytics 4 does not automatically know what actions are most valuable to your business. A “conversion” is simply any event that you have manually flagged as being important. By default, only the purchase event is marked this way (and several events related to mobile apps). For any other key action, like a generate_lead or sign_up event, you must go into the GA4 interface and flip a switch to tell the platform, “This specific event is a business goal, and I want you to treat it as a conversion.”
You can learn more about conversions (and how to configure them) here.
What is the conversion rate?
In previous Google Analytics versions, the conversion rate was calculated like this:
Sessions with conversions divided by all sessions.

That way, you can know the percentage of how many sessions had a conversion.
But in GA4, there is a welcome upgrade. I will explain that in a moment.
Two types of conversion rates in Google Analytics 4
In GA4, there are now two ways to measure conversion rate:
- Session conversion rate. This is the same as we had in the previous GA versions.
- User conversion rate where we divide users (who converted at least once) by all users
So, if you have been wondering how to check the conversion rate in GA4, let me show you. But first, let’s look at the differences between session and user conversion rates.
|
Session key event rate |
User key event rate |
|
| Formula | (Number of sessions with a key event) / (Total number of sessions) | (Number of users with a key event) / (Total number of users) |
| Business question | “How effective are my marketing channels at driving valuable interactions within a single visit?” | “What percentage of my total audience has completed a key action at least once?” |
| When to use it | Best for analyzing the immediate performance of landing pages, ad campaigns, and session-based funnels. | Best for understanding the overall effectiveness of your site at converting unique users over time, regardless of how many sessions it takes. |
| Key behavior | This rate can decrease if a converted user visits again and doesn’t convert in the new session. | This rate remains stable for a user after their first key event, even if they have subsequent non-converting sessions. |

Session conversion rate
The session conversion rate is calculated by dividing the number of sessions with a conversion event by the total number of sessions.
To understand this concept better, let me give you an example.
Let’s say that we have a user who first came to your website from a Google search, and the next time, he/she came from an email newsletter. Traffic sources don’t matter much in this case. In that second session, the user converted.
In total, we have two sessions, and one of them had a conversion.

That’s a 50% session CR.
Then we have a second user who landed on your website from a paid ad (google / cpc) and converted. Then in the next session, the user also converted. In this case, we have two sessions in total and two sessions with conversions.

That’s a 100% session CR (because 2 out of 2 sessions had a conversion).
In total, we had 4 sessions, and 3 of them contained conversions.
3 / 4 x 100% = $75% session CR.
But this logic has one flaw.
What if your goal is to convert the visitor/user once? All subsequent sessions/conversions don’t matter to you (but every additional visit still continues to reduce your session conversion rate).
That’s where the user conversion rate becomes very useful.
The addition of the user conversion rate is a welcome upgrade:
- It focuses on people, not visits. A user who visits your site five times but only buys once is a converted user. Session conversion rate would penalize the four non-converting sessions, making your performance look worse than it is. User conversion rate correctly identifies that you successfully converted that person.
- It’s better for long sales cycles. For businesses where a customer might visit multiple times over weeks before converting (e.g., B2B, high-ticket items), the user conversion rate provides a much more accurate picture of your marketing effectiveness.
User conversion rate
User conversion rate is all about users. If a user converts, the user conversion rate increases. But if, after that, the user keeps coming to your website, the rate stays the same (because the user has already converted in the past).
The user conversion rate is calculated by dividing the number of users who triggered any conversion event by the total number of users.

Let me explain this metric with a visual example.
A visitor comes to our website from a Google search (google / organic) and then comes back from an email newsletter the next day. None of those sessions had a conversion event. Thus, the user conversion rate is 0% because one user and 0 users converted.
0 / 1 x 100% = 0%.

A second visitor comes to our website and converts on the first session. Then in the next session, the visitor converts again.
We have 1 user, and that 1 user converted at least once.
1 / 1 x 100% = 100%

If we sum up the sessions of both users, we get 2 users in total and one user who had at least one conversion. 1 / 2 x 100% = 50%.
If the 2nd visitor comes back to our site once more (but does not complete a conversion event), the user conversion rate will still be 100% for that user (because that user has already converted in the past).
Conversion rate in standard GA4 reports
It’s time to build a GA4 conversion rate report. Let’s start with standard reports. While they do not include conversion rates by default, you can easily customize them.
Update: Session Key Event rate (previously known as session conversion rate) is now included in the Traffic Acquisition reports by default. You can learn more about it here.
Go to Reports > Acquisition > Traffic acquisition and click the Pencil icon in the top-right corner.

Then click on Metrics and keep looking for the Session conversion rate.

Click Add metric.

And keep looking for Session conversion rate. Click it and then hit Apply.
Finally, hit Save > Save changes to current report > Save. And that’s it! Now you have the session conversion rate in your traffic acquisition reports (that are session-scoped).

You can even select in the dropdown whether you want to view the CR of all conversions or just a particular event.
When you analyze your data, it is a good practice to look at both the conversion rate for “All key events” and the rate for your individual key events. The overall rate gives you a high level pulse on your website’s general performance. Analyzing the rate for a single event, like generate_lead, allows you to measure the effectiveness of campaigns that are designed specifically to achieve that one goal.

The same customization process applies to the User conversion rate.
How to analyze conversion rates with custom reports (explorations)?
Let’s use conversion rate in custom GA4 reports, a.k.a. Explorations. Let’s start with the sessions.
Session conversion rate
On the left sidebar, go to Explore and click Blank.

Let’s build a report of session source/medium and session conversion rates.
In the Variables column of your Free form exploration, click a plus in the Dimensions section.

Select Session source / medium and hit Import.

Important: don’t use the regular “Source/medium” dimension. If you want to see data of your *sessions*, you must use a dimension that contains *session* in its title.
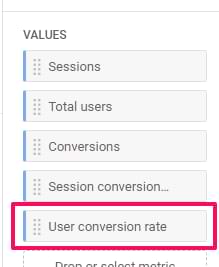
Now, click the Plus next to the Metrics and select metrics you want to include in the report, for example, Sessions, Total users, Conversions, Session conversion rate. Click Import.

Then, drag the Session source / medium to the Rows section and all metrics to Values.

And that’s it! You now see the list of your top-performing sources, mediums, and their conversion rates.

Note. You probably remember the formula of the Session conversion rate: sessions with conversions divided by all sessions. But if you divide the number of conversions by the number of all sessions (that you see in the report), the result will not match session CR. Why?
It’s because the Conversions column includes *all* conversions. Even if 1 session had 5 conversions, all 5 conversions would be included in the Conversions column. But only 1 session, in this case, will be used by the Session conversion rate metric.
User conversion rate
Let’s add one more metric. Click the Plus icon in the Metrics section:

And import User conversion rate. Add it to the report.
An additional column will appear, and you will notice that this metric is higher compared to the session conversion rate.

That’s because the User CR checks the number of users who converted. If the same person has converted at least one, it will be included in the calculation. Sessions without conversions of that user are not taken into account.
How to recreate an e-commerce conversion rate in GA4?
In the older version of Google Analytics, there was a metric called Ecommerce conversion rate. If we rephrase it in the context of GA4, it’s the Session conversion rate that looks only at website purchases.
In standard GA4 reports, it’s easy to check. Go to the Traffic Acquisition report, and customize it to include the Session conversion rate metric (like I did in this chapter). And then select purchase event in that report.

And that’s it. You are now looking at the e-commerce conversion rate within the standard report.
But what about explorations? Things get a little trickier but still possible.
Go to Explore > Blank.
And then add the following:
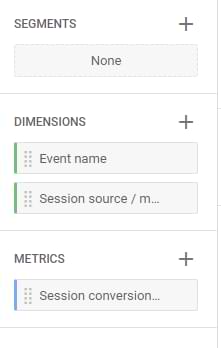
Dimensions:
- Event name
- Session source / medium
Metrics: Session conversion rate. Of course, you can add more metrics if you wish. For example, sessions, total users, ecommerce purchases, ecommerce revenue, etc.
Add Session source/medium to Rows, Session conversion rate to values.
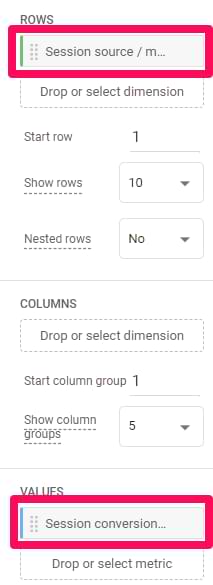
But the problem with this report is that it now includes *all* conversions in the calculation. You need to narrow down just to purchases. That’s why we will create a filter: Event name matches regex session_start|purchase. Click Apply.
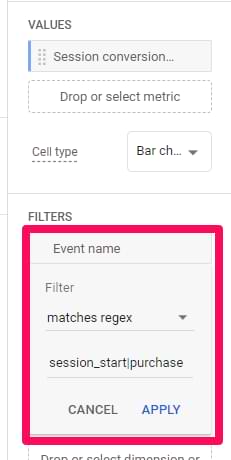
It’s important that we also include session_start here. This kind of filter will include all sessions (in the conversion rate calculation) but will use only purchase event as the conversion.
If you also include the Sessions metric in the report, it will look like this:
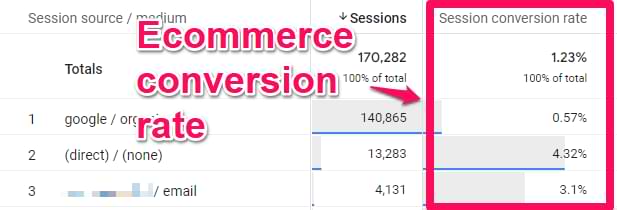
And there you have it. In the example above, the total session conversion rate is 1.23%.
Conversion rate in Google Analytics 4: Final words
Conversion rates allow us to quickly evaluate the performance of marketing campaigns, channels, mediums, etc. The higher the percentage, the better.
If you are getting a lot of traffic from a particular traffic source, but your conversion metrics are much lower than average, this might indicate an ineffective marketing channel. Unfortunately, giving universal advice on what should be fixed is impossible.
But with this metric, at least you know that *something* is wrong with that traffic source, and a company must do something.
If you want to learn how to analyze conversion data and get insights, look at my Google Analytics 4 course, where I focus a lot on that.
Also, I appreciate the addition of the user CR because working just with the session metric is not enough.
44 COMMENTS
Is there a way to find the ecommerce conversion rate in GA4?
Select "purchase" as an event of which you see the conversion rate
Thanks Julius, would this be the same e-commerce conversion rate we would see in the e-commerce overview report in UA?
Not identical, but similar
Hi Julius
Thanks for bringing up this important topic.
I would like us to clarify some things from your article:
1. "In previous Google Analytics versions, the conversion rate was calculated like this: Sessions with conversions divided by all sessions."
- We had two different conversion rates in previous Analytics versions.
In Universal Analytics (UA), we had one for goals and another for ecommerce. Both are counted differently and the calculation in your text is used for goal conversion rate in UA.
2. "In Google Analytics 4, there are 2 types of conversions:
Session conversion rate. This is the same as we had in the previous GA versions."
- Yes, but for goal conversion rate only,
ecommerce conversion rate is calculated differently.
3. "Note. You probably remember the formula of the Session conversion rate: sessions with conversions divided by all sessions.
But if you divide the number of conversions by the number of all sessions (that you see in the report), the result will not match session CR. Why?"
"It’s because the Conversions column includes *all* conversions. Even if 1 session had 5 conversions, all 5 conversions would be included in the Conversions column. But only 1 session, in this case, will be used by the Session conversion rate metric."
- Great highlight. Dividing the number of conversions by the number of all sessions is actually the calculation that is used in UA for ecommerce conversion rate. See the confusion here?
In other words, session conversion rate in GA4 is not matching up with ecommerce conversion rate in UA. Different calculations are used. Comparing ecommerce conversion rate in UA with GA4 will show that you CR% is now actually lower than before.
The best way to compare would be to add a calculated metric to GA4, using the old UA EEC calculation??
But to my understanding, this is still not available.
Looking forward to hear your thoughts on this
"session conversion rate in GA4 is not matching up with ecommerce conversion rate in UA. Different calculations are used. Comparing ecommerce conversion rate in UA with GA4 will show that you CR% is now actually lower than before."
I noticed this as well. In GA4 for my website, if I divide the number of conversions by the number of all sessions, it doesn't match with session conversion rate ;(
I still don't understand why and what different calculation GA4 is using. Hope somebody would explain...
Hi Ellie
GA4 conversion rate is using this calculation:
sessions with conversion/all sessions x 100...
...which is the calculation that was used in UA for Goals.
BUT
If you calculate the conversion rate yourself directly from GA4 interface using conversion/all sessions then your basically using another definition...
...which is the calculation that was used in UA for EEC (enhanced ecommerce).
Not a smooth transition between UA and GA4 for such a important metric :)
Hi William,
A workaround to the problem might be to create a calculated metric in UA that mimics GA 4 session conversion rate by using UA metric “Sessions with conversions”.
Hi William,
That explains! Thank you so much.
Hey
I have a matter.
If in a session we have 2 conversion, our CR is 100 or 200%?
100
…And in UA and EEC it would be 200.
>> Session conversion rate
The session conversion rate is calculated by dividing the number of sessions with a conversion event by the total number of users.<<
I'm not sure if I understand, shouldn't it be by the total number of sessions?
Oh, yes. That was a typo. Will fix it tomorrow, thanks
Oooh, okay, phew!
I do have another question. I've read the article a few times and followed the instructions to create the reports and the exploration, but, still, the numbers don't match if I calculate it by myself.
For example, in the explorations report (with the filter, etc.), coming from direct, I have 360,261 conversions and 1,235,780 sessions and the CR is 29.53%. If I calculate it by myself, that doesn't match. What am I doing wrong? What is it that I don't understand?
Thank you! :)
They will never match. Sessions are calculated "once per event". If a visitor completes the conversion 3 times per session, that is 3 conversions.
But in the session conversion rate calculation, not "3", but "1" is taken into account (because there was 1 session with the conversion).
Thank you so much for your answer Julius! :)
Hi Julius!
I don't see the pencil icon in my GA4 UI. Is it gone now or am I just special?
Thanks (˃̣̣̥‿˂̣̣̥)
Sounds like you don't have enough permissions in the property
Amazing post as always! wondering how we can get Conv rate in a trendline. In UA we had this info as trendline, but i can't find a way to do it. Any recc is highly appreciate it
thanks
Hi Julius, is there a way to get a line graph view of conversion rate (for an event of your choosing) to see how it has changed over time? Either in GA4 or (preferably) Looker?
Looking for the same solution - a single value calculated as in this tutorial is different than if I create a timeline chart.
Hi Julius, does it seem odd to you that conversions would be higher than total users? Appreciate maybe not for a ecommerce website, but if your website is collecting leads should you not see the total users be almost identical to the number of conversions?
One user can repeat the same conversion multiple times
Or you are tracking too many duplicate conversions
Hi Julius, thank you for your amazing tutorials and work :D, i'm facing an issue with the search part, we migrated from UA to GA4 and in the search i have the search_term value and the number of Results Pageview per Search but before it was automatically calculated by UA and in GA4 it doesn't exist anymore so i believe i must calculate it myself do you know how can i create rates directly in GA4
You can't
Thank you for your answer, but that's really bad, how could i do that on your opinion ?
Is this still the case?
Looking at CVR by search term would be very helpful in assessing the effectiveness of site search?
Any analytics packages that would help give us this info?
hi, I'm getting some crazy conversion rates with this exploration report...
Like 2560 conversion for a past week (which is correct), 0.45 conversion rate overall(which manually calculated is also correct), but cant see from where, since calculating the rows, I can see shown only 8 of them...
Any suggestions?
Apparently, loads of it comes from our payment gateway, is there a way of making it count as internal traffic?
I want to know how to calculate the conversion rate as (total conversions / total sessions) x 100. How can I do that in GA4?
For example, I have one user who converts 3 times in one session. That should be a 300% conversion rate for the session.
Is this possible in GA4?
Try creating a calculated metric
Thanks for all your great GA4 content Julius; I've used quite a few of your tutorials to help set up better GA4 reporting. This has been another excellent one for helping understand conversion rates. I added Landing page + query string + google /organic filter to better understand CR's by landing page and organic search traffic.
How can I get the number of users that made (at least) a conversion?
In particular, a file download?
I try to reformulate since my question wasn't clear.
In the report I am able to see how many downloads happened, but a person might download many documents. I can filter to see for each file how many downloads took place. But what I need to know is, instead, how many users downloaded a file (nomatter how many). I can't understand how to get this apparently simple data.
Hope this clarify!
Thanks.
Has this been updated b/c I'm not seeing the metric for "session conversion rate" in the Explore option
Look for "Session key event rate". GA4 changed
Very helpful post, thank you. I'm looking to re-create the e-commerce conversion rate in my reporting platform and the regex conditions used for GA4 may not work for my platform due to the differences in partial/fully matched regex. Do you have any suggestions for expressions I could try for a partial-match?
Hey Julius,
Thanks for the article – it's been super useful. I can't find the "conversion rate metric" session anymore. I noticed in another comment that it might have been changed to "session key event rate," which I've used, but won't that trigger for all events? I'm just looking to track purchases. I tried adding a filter to include only events containing "purchase," but it didn't seem to work.
Any help would be greatly appreciated.
HiJulius,
Thanks to your article I was able to create line charts for 2 important conversions of our business through adding the filter you mentioned:
session_start|lead
session_start|purchase
I would also love to create a line chart with the session key event rate lead to purchase in order to better analyze the sales funnel (session_start to purchase is very low). Is there a way to do it?
Just a note:
Nowadays the key event count can be switched to one per sessions. That should solve the issue that the calculation you get in the table dont match Googles conversion rate calculation. At least on session level.
Can you talk about why the session metric to the session_start event are not the same? It seems like using the session_start event as part of the filter for calculating conversion rate would result in an artificially high conversion rate since session_start is always less than the actual sessions
Hello Julius!
Would you recommend using user/conversion rather than session/conversion to calculate CVR for a B2B SaaS industry?
I mean, who makes company decisions on the spot? Like partnering with an Ecommerce Platform, or a Payment solution.
Users tend to create many sessions before deciding.
What is your opinion?