
May 8, 2025
How to check if Google Analytics 4 is working?
Updated: May 8th, 2025
After you have installed GA4, you want to be sure that you did everything correctly and that the data is being collected. In this blog post, I’ll walk you through several steps you must complete. Otherwise, you will find out (say, after a week) that you were collecting incorrect data (or no data at all!).
Without further ado, let’s check if Google Analytics 4 is working.

Video tutorial
Quick side note. If you prefer video content, I have recorded a tutorial that covers the same topic.
Note: GA4 interface has slightly changed since I recorded this video. Debugview is not located at Admin > Debugview.
#1. Check Preview And Debug Mode
This might be obvious for most GTM users, but this is where most beginners make mistakes. After you have installed GA4, click the Preview button in the top right corner.

A popup will ask you to enter the URL you want to test and debug. It might be the address of a homepage or it might be a specific page’s URL, and then press Start.

A new browser tab (or window) should appear where you will see the URL that you entered in the previous popup. At the bottom of that page/tab, you must see the following badge:

And if you go back to the tagassistant.google.com tab, you must see this success message.

If you don’t see the success message or if the preview badge shows that the debugger is not connected, read this.
Once the preview mode is enabled, click the event (on the left side) when your GA4 tag was supposed to fire. If you have set the tag to fire on All Pages, it means that you need to click Container Loaded.
Once you do that, you should see that your tag has been fired. Keep an eye on the status here:

It MUST be Succeeded. If it is Still Running, that isn’t good, and you should read this blog post for possible fixes.

#2. Check Google Analytics 4 DebugView
When you implement something in Google Analytics 4 (or any other platform), never trust your gut. Always verify that the data was received by the platform and is displayed in reports how you expect it.
In GA4, this can be done with a feature called DebugView. It allows checking the incoming data more granularly (without waiting for hours).
There are three ways to enable DebugView, and I have explained them here. But in today’s blog post, I presume you are using Google Tag Manager to install GA4. So as long as you have enabled GTM’s preview mode, you will also see your data in GA4 debugview.
You can find it by going to Admin > DebugView on the left side of the GA4 interface. Click it.

That’s the place where your debugging should take place. Do not mix this with the GTM Preview and Debug mode. They are two different beasts.
In the DebugView, your events are displayed as a feed/stream. Click on an event that interests you, and if you want, you can also check the parameters that were sent together with the event.

If you see your incoming events in the DebugView, there’s a very high chance that everything works fine. For a basic setup, look for the page_view event. Click on it. In the ‘Parameters’ tab:
- Check page_location (the full URL of the page viewed)
- Check page_title (the title of the page)
If you’re testing a custom event (e.g., a button click named cta_click), find that event in the timeline. Click on it and verify that all the custom parameters you configured are present and have the correct values. An empty DebugView or missing key parameters often indicates a problem with your GA4 tag firing or its configuration.
If you want to learn more about DebugView (or maybe it is not working as expected), read this blog post.
#3. Google Analytics 4 Real-time reports
When you publish your Google Analytics 4 tags in Google Tag Manager, it’s a good practice to check whether data (of your visitors) starts to come in. To do that, go to Reports > Realtime (on the left sidebar).
First, you will see a map and a bunch of cards with traffic sources, the most popular events, and the number of users in the last 30 and 5 minutes. You can also take a look at the snapshot of an individual user. You can do that by clicking the View user snapshot button in the top right corner.

Then, you will see a stream of all events of that particular user. You can click on them (just like in the DebugView) to see things on a more granular level. If you wish to look at another user/visitor, you can click the button here:

To exit the snapshot, press the Exit snapshot button in the top right corner.
What’s important here is that you must see some data in real-time. If you expect to have some traffic but you see 0 users in real-time reports, something is misconfigured.
If you followed a certain tutorial, re-read it again. Or, if you need more support from me, you can enroll in my GTM online courses. I always help my students with struggles like this one.
#4. Browser developer tools
This tip is more technical compared to the previous ones. You can check the developer tools of your browser and check all the outgoing requests sent to Google Analytics 4.
Since my browser of choice is Google Chrome, I will be using it to show the example.
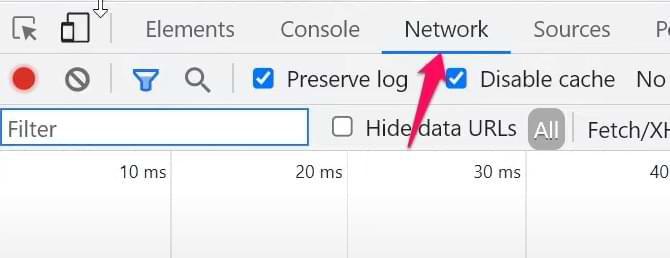
In the top-right corner, click 3 dots, then More tools > Developer Tools.

Then select Network.
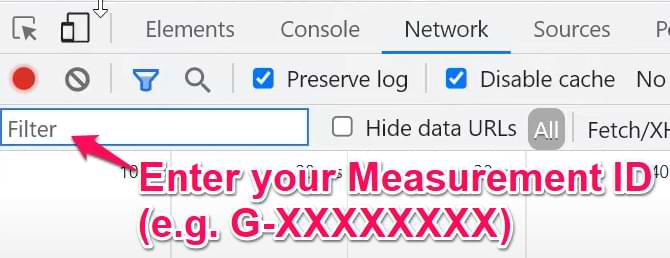
In the search field, enter your measurement ID (because all requests sent to Google Analytics 4 are sent to URLs that contain your Measurement ID). It looks like this: G-XXXXXXXX. Obviously, you should replace XXXXXXX with your actual ID.
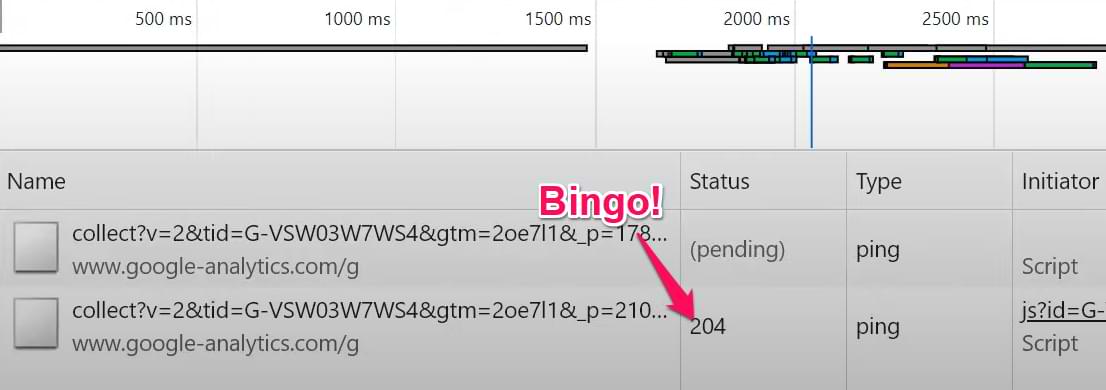
Check the status of those requests. If it is 204, then things are looking good. You can ignore requests with “(pending)” status.
Bonus: while you’re in the developer tools, check the Console tab as well. Maybe you will find some errors related to “Google Analytics”, “gtag”, or something similar. If yes, then consult with your developer whether that error is critical or not.
#5. Check reports
Important: The data can take up to 48 hours to appear in standard reports.
Even though I have already mentioned several other verification methods, it is necessary to check the final destination of your data, which is standard GA4 reports. This includes the Reports and Explore sections on the left sidebar.
There is a variety of different reports in GA4, and I will not dive deeper in this blog post, but here are several articles that might help:
#6. Verify cross-domain tracking setup
If your business operates across multiple domains and wants to track them in a single GA4 property, you must configure cross-domain tracking. Your main goal here is to ensure that when a visitor navigates from domain A to domain B (of the same business), the value of the _ga cookie stays the same.
Watch this tutorial (starting at 6:43) to learn how to do that.
If you want to learn more about cross-domain tracking setup in general, read this blog post.
Check if Google Analytics 4 is working: Final Words
Hopefully, this quick checklist of how to check if Google Analytics 4 is working helped you. You need to check various parts of the flow:
- Is the GA4 tag fired?
- Is the request properly sent to Google Analytics 4? Because even if the tag fires in GTM Preview mode, that does not mean the request was sent properly.
- Can you see the incoming data in DebugView?
- Can you see the data in reports?
7 COMMENTS
For the Dev Console > Network tab > why would the response be as 204 and not 200?
Because 204 is still a success. GA4 is coded in a way to use 204 status https://httpstatuses.com/204
What if GA4 is installed via Google Tag Manager. Can it be verified in some way without access to Google Analytics and Google Tag Manager?
You can still check requests in the browser's developer tools > Network tab
Is there any way to see from the source code whether a website has GA4 installed (even if it isn't your site)?
I'd like to use this approach to prospect for new SEO clients.
I can help clients update their analytics and start a conversation about SEO benefits etc.
I know we can check for UA-xxxx in the source, but it seems like GA4 doesn't have any defining source code characteristics.
Can you advise?
GA4 has almost the same characteristics - G-XXXXXXX
Your article is very helpful. I recently installed GA4 only to discover that I had to use Google Tag Manager also. The entire experience is like walking through a maze. I'm still not sure if I've set GÀ4 up correctly. I'll try to use your report to see if things are all good.