
March 1, 2024
28 Google Tag Manager Debugging and Testing Tips
Updated: March 1st, 2024
Google Tag Manager debugging is an art of its own. Checking the Preview and Debug mode to see whether the tag successfully fired is just the tip of the iceberg. You need to follow many more things/techniques to ensure that everything is working correctly (or just to find the reason that is causing some nasty bugs).
In this guide, I’ve collected a list of Google Tag Manager debugging and testing tips (and some tools) to help you better understand what and where to check within your container. Some of them overlap; therefore, in the end, it’s up to you which ones to use. Let’s start, shall we?
Before we continue
This list is definitely far from complete; therefore, I would like your input. If you see some useful debugging techniques missing, please let me know in the comments or contact me via other channels (e.g., social media, email, or contact form). Also, there’s still a high chance that I still don’t know or just forgot to include something, so any input from my audience is appreciated.

Video tutorial
Some of the debugging tips I will cover in this blog post are explained in my Youtube video (see below). Even though some parts of the video might be outdated, most of the content there is still relevant.
Let’s move to Google Tag Manager Debugging Tips
I’ve written down a bunch of tips/suggestions/ideas and then split them into categories:
- Debugging tips related to the GTM Preview and Debug mode
- Tips related to the built-in browser tools
- Google Tag Manager debugging tips related to browser extensions
- Other GTM debugging tips
Table of contents
Here’s what you will learn in this article
- Part I: GTM debugging with the Preview and Debug mode
- #1. Want to share preview and debug mode?
- #2. Sometimes, you need to do more to exit the preview mode
- #3. Preview and debug mode may not always work
- #4. Left side of the Debug mode displays changes in the Data Layer
- #5. Some events in the preview mode are displayed differently
- #6. Enhance preview mode with Tag Assistant Companion
- #7. Want to debug iframes? Tag Assistant Companion will also help
- #8. Debugging multiple domains of the same user journey?
- #9. If you want to use a particular data (from the Data Layer)
- #10. Keep an eye on the Errors tab
- #11. Check what values were sent to a 3rd party tool by clicking on a tag
- #12. The Summary shows how many times each tag was fired
- #13. View trigger conditions by clicking on a tag
- #14. Preview and Debug mode does not show everything
- #15. Missing Container Loaded Event?
- Part II: Google Tag Manager debugging with built-in browser tools
- Part III: Google Tag Manager debugging with browser extensions
- Part IV: Other GTM/GA debugging tips
- Final words
Part I: GTM debugging with the Preview and Debug mode
In this part, I’ll dive deeper into the standard GTM Functionality.
#1. Want to share preview and debug mode? Always include the destination URL and select GTM container
There are two main reasons why you want to share your Preview and Debug mode:
- show someone how you implemented changes in the container (say, for QA purposes)
- get help from someone to debug a particular issue for you.
The latter point is the reason why I included this “tip” in this list at all. If you want to get GTM help faster from someone (for example, in the GTM community on Facebook), do your best to provide as much information as possible. The information must also include the page URL to debug the issue.
To share the preview mode with someone, first, you need to enable the preview mode yourself, and then in the top right corner, click three dots > Share.

Then a popup will appear where you will have to:
- Enter the link of the website where the preview mode should be enabled
- Select which container to enable (if there are multiple GTM Containers or GTAGs). IMPORTANT: you must select the GTM container in the dropdown.
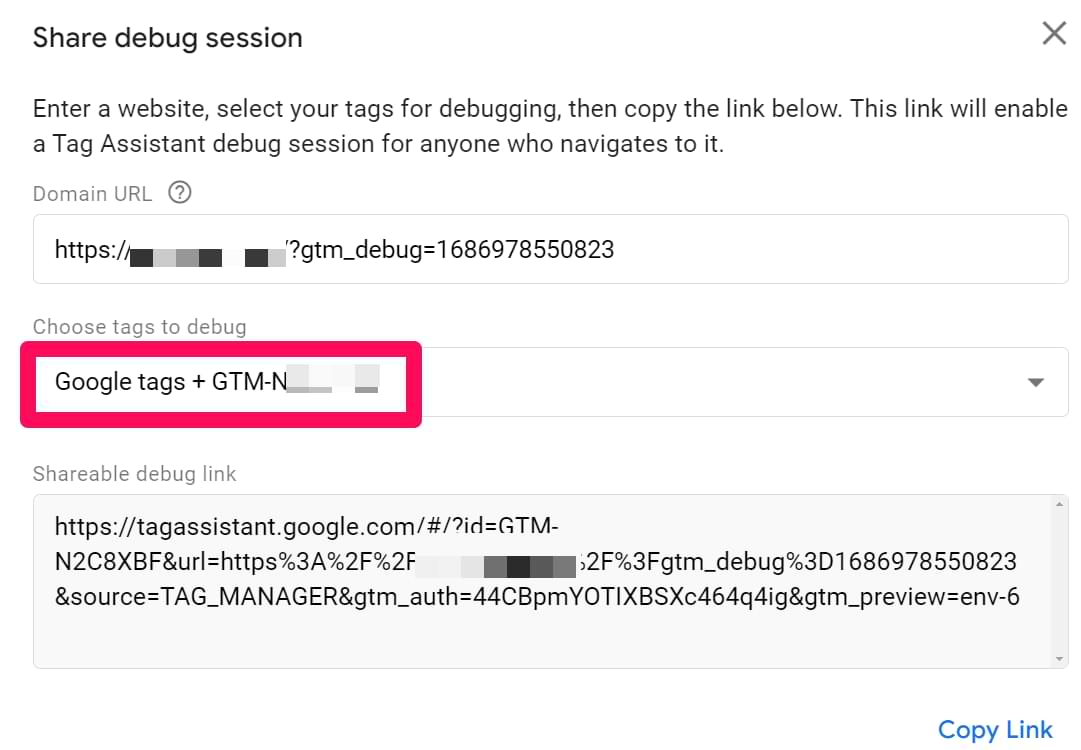

- Copy the link and share it with someone you wish.
I’ve had too many times when a person sends me a link to the P&D mode without entering the destination URL where I should check. I’m not a psychic to read your mind.
So even though this tip is not directly related to YOUR debugging, it will make the job easier for the person who wants to help you and debug.

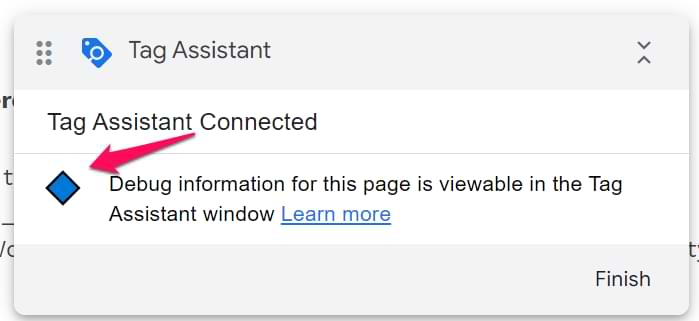
#2. Sometimes, you need to do more to exit the preview mode
Even though you have quit the preview mode, you still might see this widget at the bottom of your website:
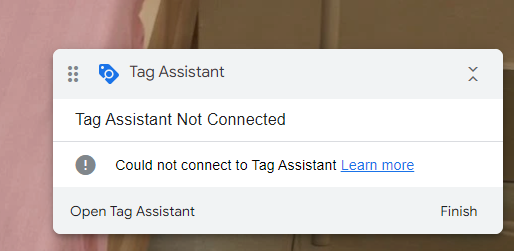
There are several reasons for that (for example, you didn’t properly delete the first-party cookie, or you have enabled the GA Debugger extension). In this blog post, I share several tips on what to do in such a situation.
#3. Preview and debug mode may not always work and there are many causes for that
There are many reasons why the GTM Preview and Debug mode does not work on your (client’s) website. In fact, I’ve listed the most common (and some uncommon) reasons and solutions to them. The list contains (but is not limited to):
- Wrong container
- AdBlockers
- etc.
#4. The left side of the Preview and Debug mode displays changes in the Data Layer
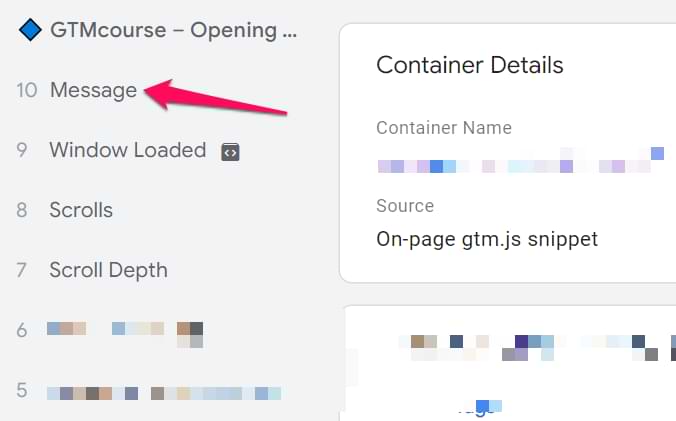
Click any interaction to inspect what happened in the Data Layer at that moment: what data was (un)available. Every dataLayer.push is visible in this stream. If the push has an event key, then that very exact key name will be visible in the stream. If there is no event key, the dataLayer.push will be displayed as Message.
#5. Some events in the preview mode are displayed differently as they really are
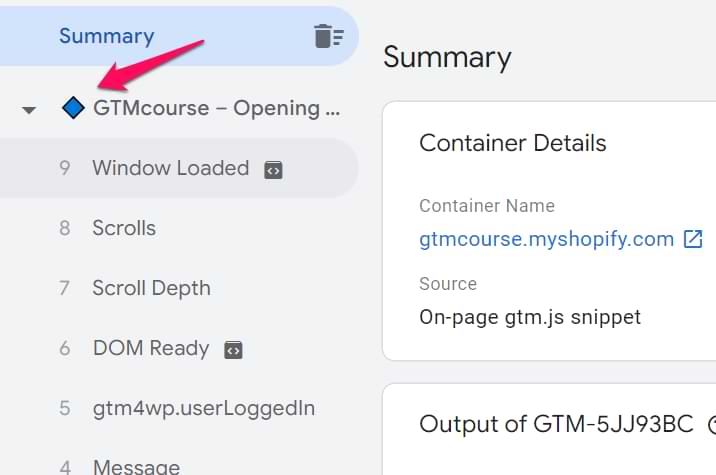
When it comes to standard events (like link clicks, YouTube video events, etc.), the Preview mode displays them in a more user-friendly manner. Instead of seeing a technical “gtm.click” event, you see the “Click”.
But even though this is a bit friendlier, it is also more misleading. Here are some of the events (with their real technical names) that are displayed differently on the left side of the preview mode:
- gtm.click = Click
- gtm.linkClick = Link Click
- gtm.video = Youtube Video
- gtm.triggerGroup = Trigger Group
- gtm.js = Container Loaded
- gtm.dom = DOM Ready
- gtm.load = Window Loaded, etc.

#6. Enhance preview mode with Tag Assistant Companion
If you want, you can improve the Preview mode by installing a browser extension called Tag Assistant Companion. Doing so is especially useful if you hate when your website (during the debug) is opened in a new window (at least, this happens on Google Chrome).
With the extension installed, your website will be opened in a new tab (instead of a window) when you enable the preview mode. This means that you can use things like mobile debugging again.

Also, you will be able to debug multiple tabs simultaneously.
Furthermore, you may notice some shapes/emojis appear in the event timeline and in the Preview mode’s badge (on your website). These shapes help you quickly distinguish which window is currently being debugged.
#7. Want to debug iframes? Tag Assistant Companion will also help
iFrame debugging with the preview mode is more complex than you might think. Tag Assistant companion can also help in this case. Learn more here.
#8. Debugging multiple domains of the same user journey? Enable preview mode for every domain separately
If you are working with multiple domains (that are part of the same customer journey) and those domains are using the same Google Tag Manager container, you will need to enable the preview mode on both domains.
First, open tagassistant.google.com (or just click the Preview button in the GTM Interface) and enter the domain of the 2nd website. Complete all the necessary steps to enable the preview mode.
Then (also on tagassistant.google.com) click the X icon in the top left corner + select Keep the domain XXXXX enabled for debugging. Click Close Debugger. That way, you’ll keep the 2nd website in the preview mode.

Then press either the Preview button in the GTM interface OR Add domain button in tagassistant.google.com and add the domain of the 1st website. Complete all the necessary steps until Website 1 is open in a new tab or window.
What we have done here is that we set the _TAG_ASSISTANT=X first-party cookie on both domains (you need this for the preview mode to work). That’s why you can now navigate between both domains in the preview mode and see all the events/data coming from both websites.
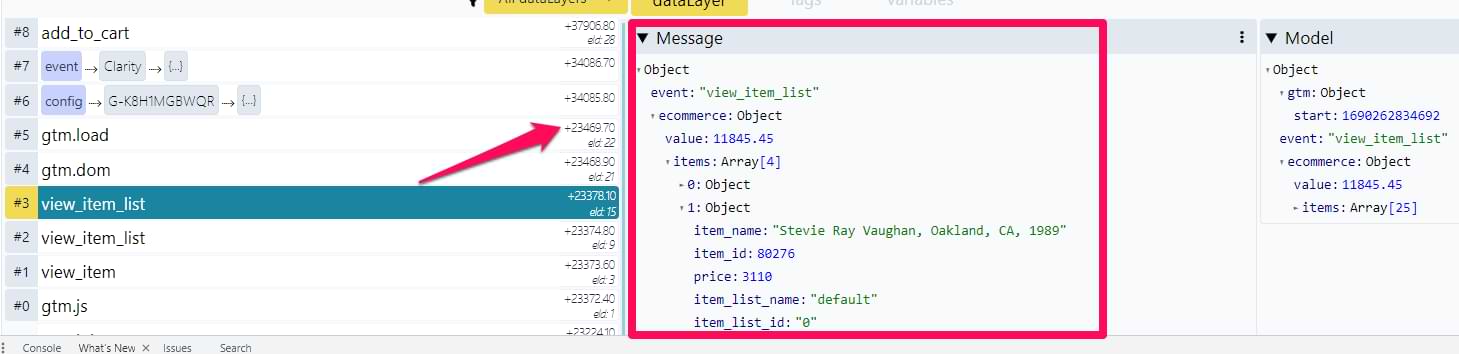
#9. If you want to use a particular data (from the Data Layer) in a GTM tag, make sure that this data is available as a variable in that specific Data Layer event
Take a look at the screenshot below.
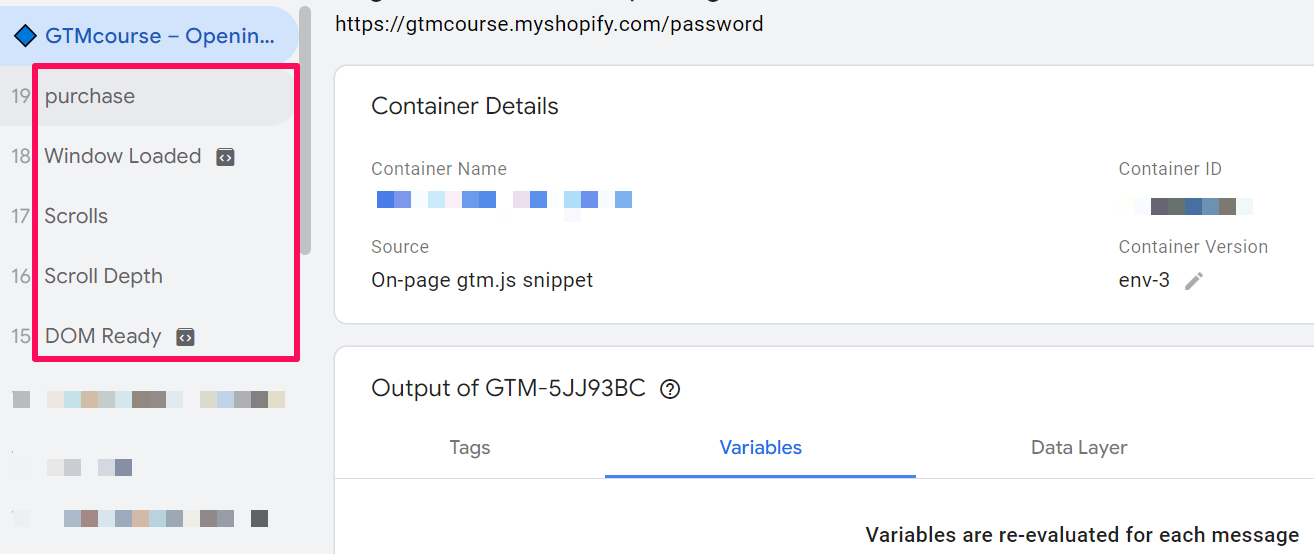
There are several interactions in the Data Layer:
- purchase (custom dataLayer.push)
- Consent Initialization
- Initialization
- Container Loaded
- DOM Ready
- Window Loaded
With the purchase event, there was some user-related data pushed to the Data Layer, including value. Now, suppose you want to pass the value of value with another event to a 3rd party tool, like Google Analytics or Facebook Pixel. In that case, you need to make sure that the value to be captured by the variable is actually available in the Data Layer.
You can easily check that by:
- choosing the purchase event in the Preview and Debug mode (because you want to fire a tag upon this event)
- and going to the Variables tab.
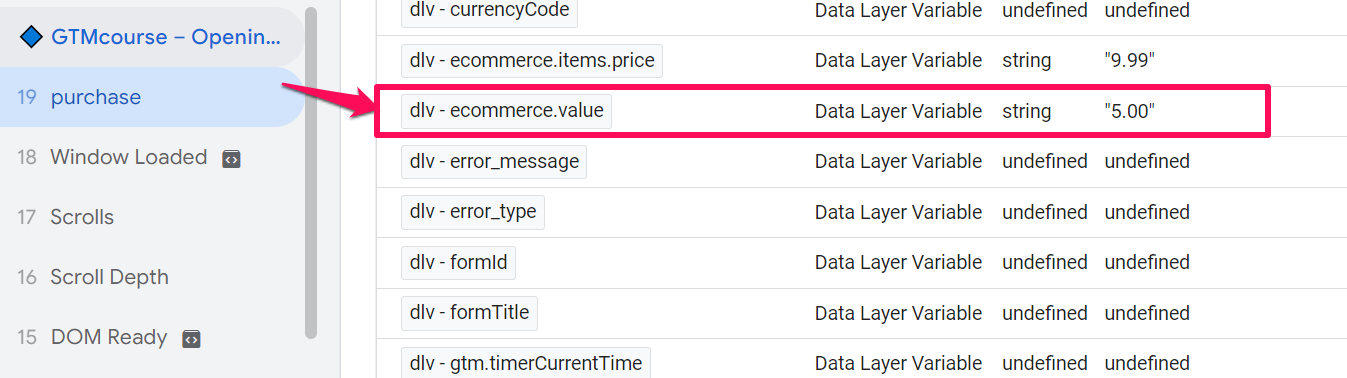

If the variable contains some actual value (not an undefined, NaN, etc.) on that Data Layer event, you can use the variable in a tag to send its value to a 3rd party tool. Remember that custom data in the Data Layer is not available by default in the Variables tab of the Preview console.
It’s important to note that the value variable may not appear in every stage shown in the Preview and Debug mode. That is one of the most common mistakes among GTM beginners: not checking if the variable is available and capturing information when a tag fires successfully.
If a variable is unavailable in the Variables tab, then go to the Data Layer tab and see if the needed data is there. If yes, enable a proper built-in GTM variable or create a Data Layer Variable.
To sum up, if you want to use a particular data from the Data Layer in your tag, make sure it is available there. If a particular key is pushed to the Data Layer only after a click, it will not be available with the Page View event (because it happens sooner than the click).

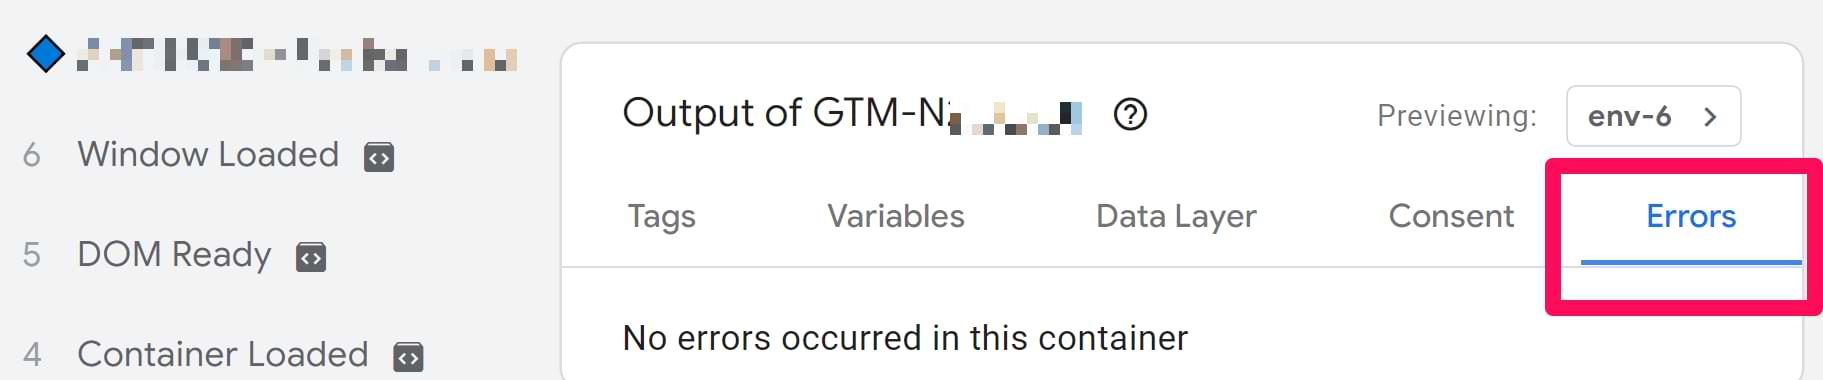
#10. Keep an eye on the Errors tab
This feature is pretty new in GTM and isn’t used too often (at least from my experience). But if you notice any number in the tab (rather than 0), click it to identify the cause. This tab displays if a GTM Tag Template failed to fire due to an error. Here’s a quick guide about it.
#11. Check what values were sent to a 3rd party tool by clicking on a tag
Choose an event in the Preview and Debug mode’s event stream and click the tag that fired on that event.
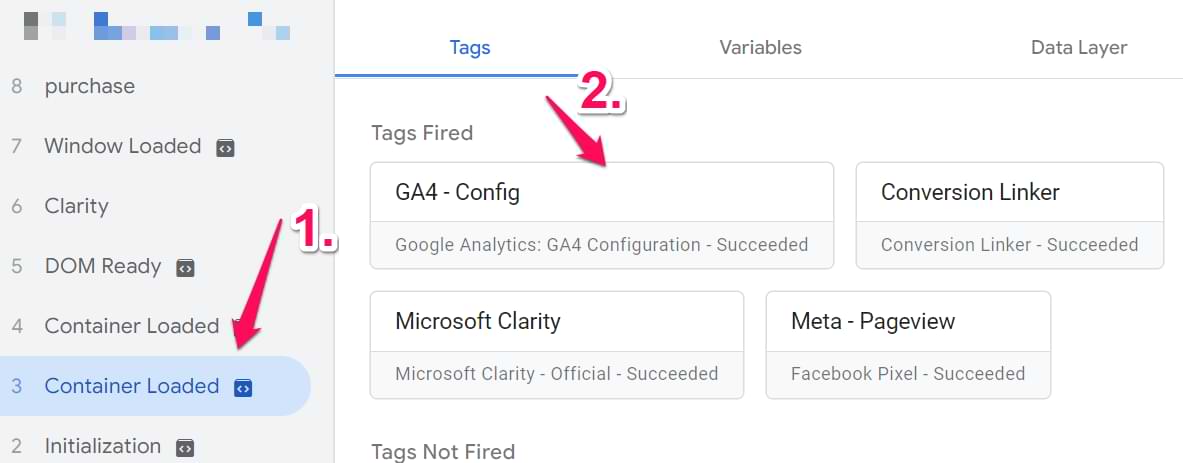
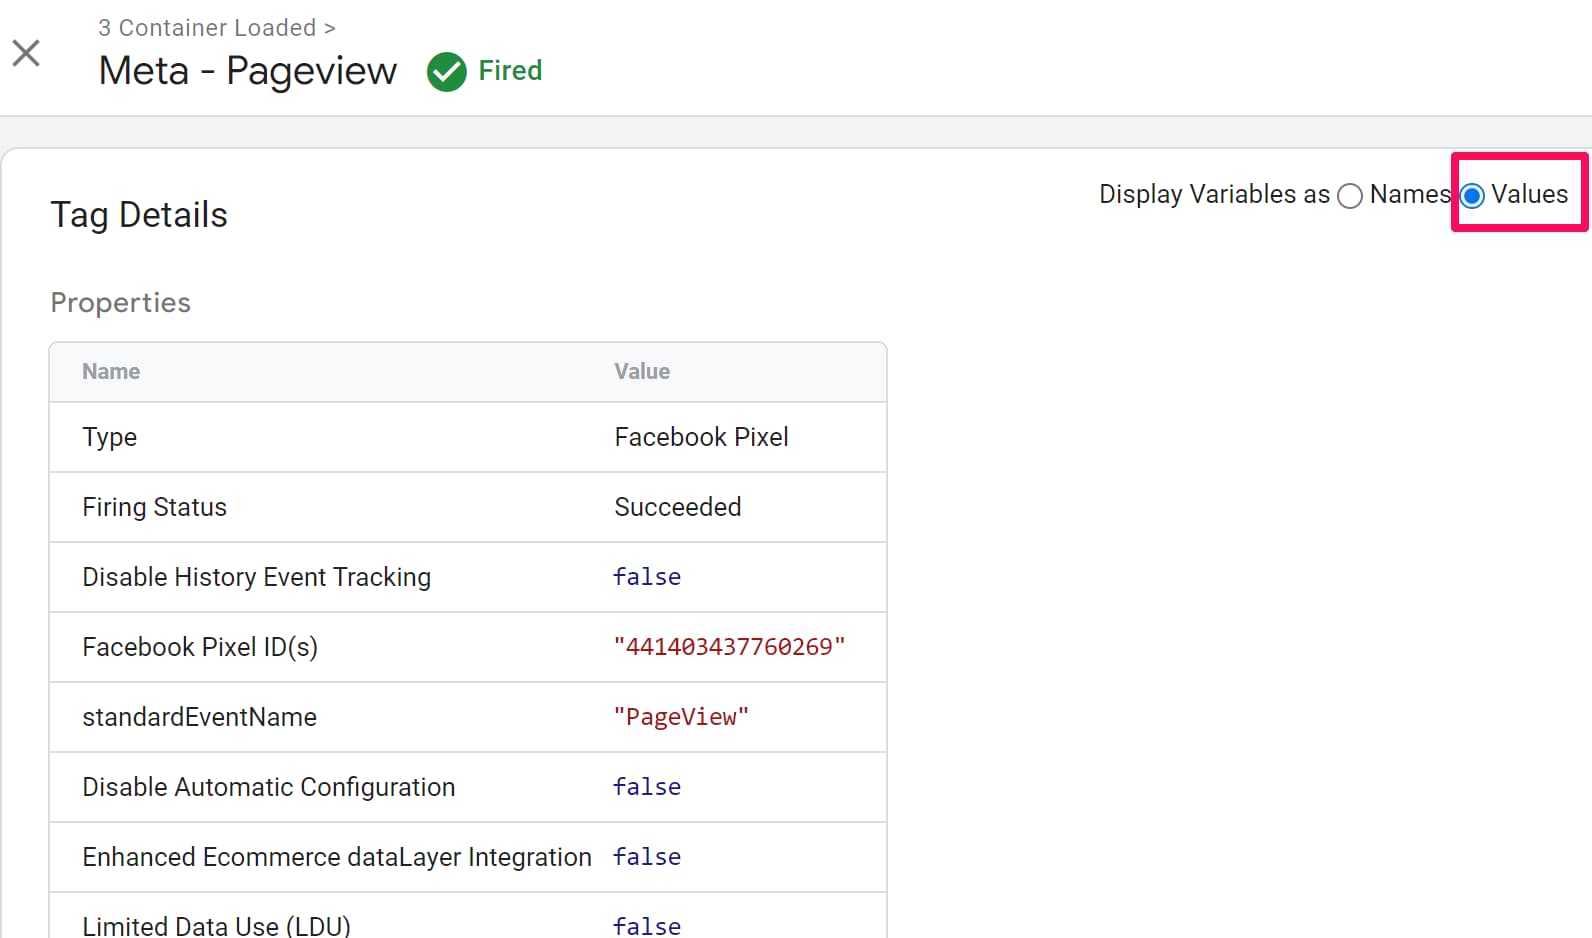
If needed, expand the table to see what configuration was of that particular tag and what data was sent to a 3rd party tool (like Google Analytics). By default, you might just see the variable names.

But if you switch to “Values,” you will see the output of each variable (which is much more informative):
#12. The Summary shows how many times each tag was fired
This is useful if you planned a particular tag to fire only once but, in fact, it was triggered several times by multiple triggers.
VERY IMPORTANT: Do not debug individual tags while having a Summary selected above the event timeline. This is an incorrect way to do it. Always select the event in the event stream first and only then click the tag to debug.
#13. View trigger conditions by clicking on a tag
If you want to find out why a particular tag did or did not fire, choose an event in the Preview and Debug console’s event stream and click the tag that has fired (or not).
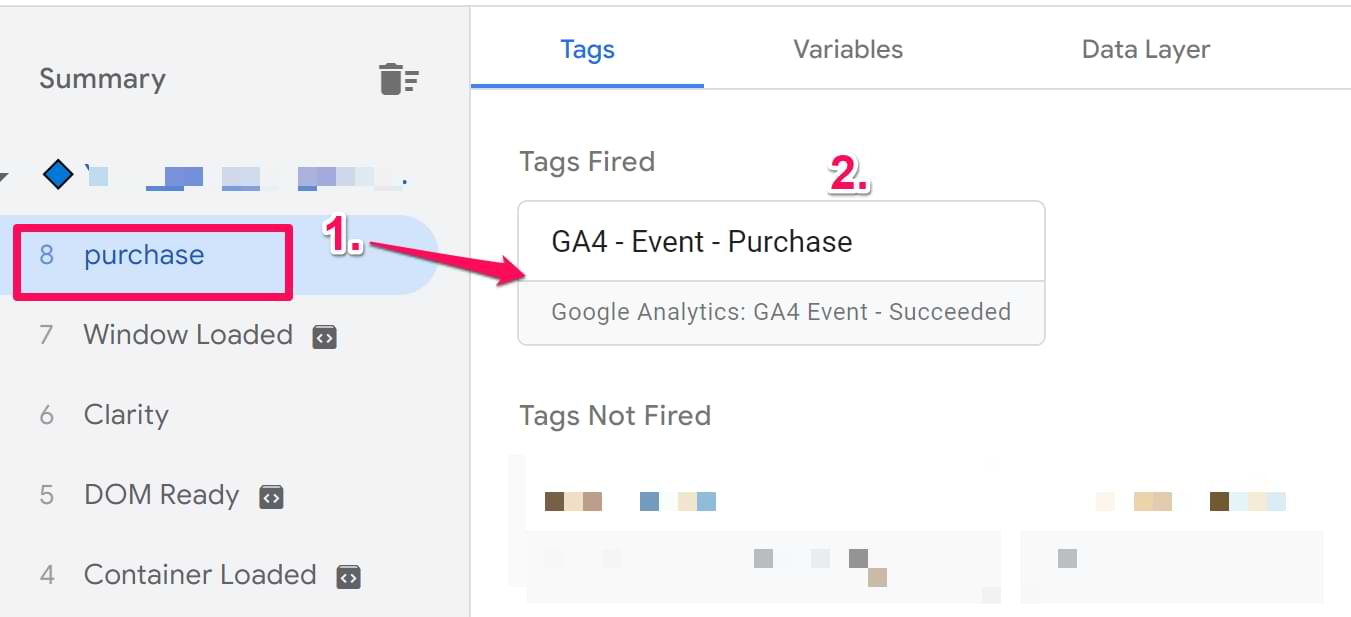
When you do that, you will see:
- The data that was sent
- Firing triggers (and which conditions were met)
- Blocking triggers
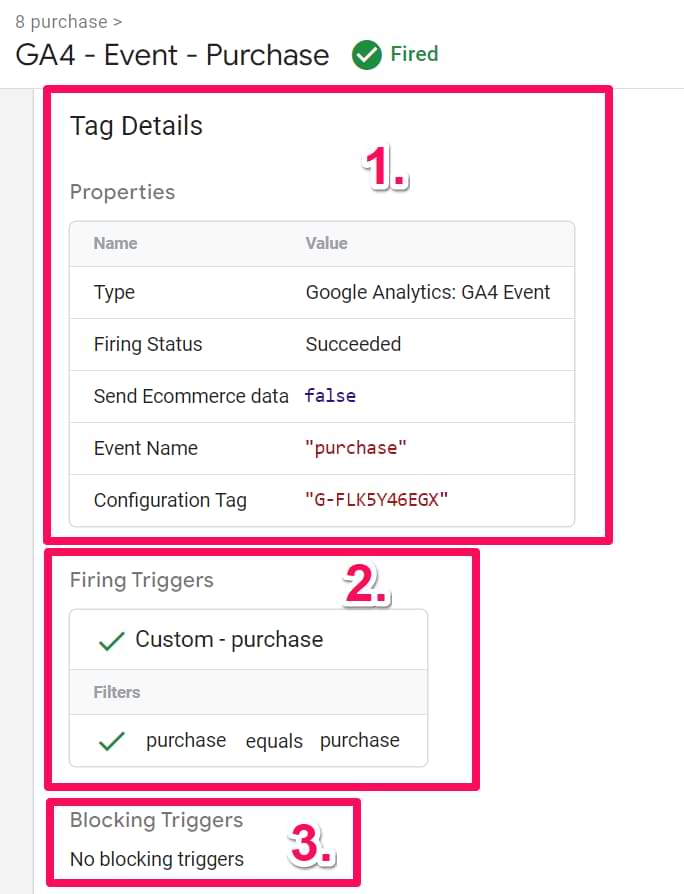
Take a closer look at the icons. If a trigger has a green check icon, that means that this trigger activated the tag.
This helps you identify possible reasons why one or another tag has been fired (or not).
#14. Preview and Debug mode does not show everything related to firing conditions
There is a chance that such a situation has already happened to you once (or will happen in the future). A tag has fired even though conditions in your triggers were not met. Or the opposite, all conditions were met, but the tag did not fire. Why do such things happen?
Not everything (related to tag firing conditions) is displayed in the Preview and Debug mode. I’m talking about Tag Sequencing and Tag Firing Options.
If you set a tag to fire before or after another tag (via Tag Sequencing), this will not be visible in the Preview console under the Firing Triggers section. You can only see it in the GTM UI by opening a particular tag and scrolling down to the Triggering section.
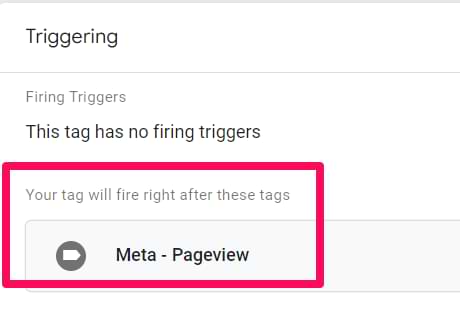
Anyway, as a result, you might start thinking that your tags are firing even when they shouldn’t, but that’s not true. It’s just that the Preview console does not display the Tag Sequencing (that’s a feature request right here).
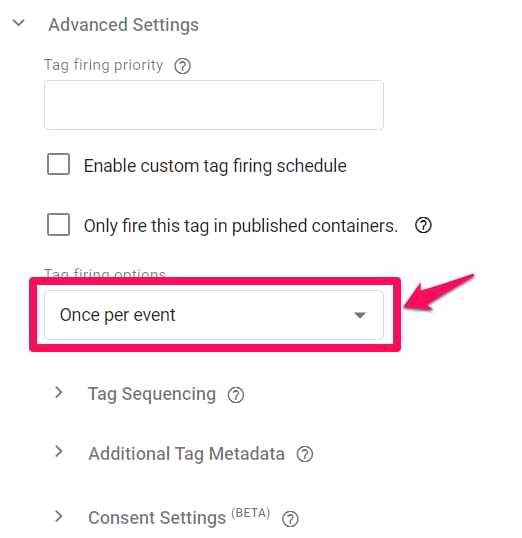
Speaking of tags not firing even though they should, another setting that may prevent that is Tag Firing Options. You may have set a tag to fire only once per page load. This means that a tag (which has already fired) will not fire anymore, even if all the conditions are met. That setting can be found under the tag’s Advanced Settings.
Learn more about the reasons why your tags might not fire (and which ones are not displayed in the preview mode).
#15. Missing Container Loaded Event? Not seeing any events in the preview mode at all?
Every time a page loads, at least 5 Data Layer events are visible in the Preview and Debug mode:
- Consent Initialization (gtm.init_consent)
- Initialization (gtm.init)
- Container Loaded (gtm.js)
- DOM Ready (gtm.dom)
- Window Loaded (gtm.load)
And it always should be like that. At least 5. However, sometimes the Data Layer is implemented incorrectly on a website, which causes the Container Loaded (gtm.js) event to break. This happens because a developer places the following Data Layer snippet below the Google Tag Manager container:
<script>
dataLayer = [];
</script>
So whenever you are debugging Google Tag Manager implementation, keep an eye on whether all five Pageload-related events appear in the Preview and Debug mode.
A solution for this? At least ask a developer to place the Data Layer code above the GTM container. But an even better option is to use dataLayer.push instead of dataLayer=[]. Then the position of the snippet is not that important anymore.
I’ve published a guide explaining this issue, so feel free to read more about it.
Part II: Google Tag Manager debugging with built-in browser tools
Making use of the standard browser functionality for developers.
#16. Check the browser’s JavaScript console for errors
Since I’m mainly using Google Chrome to work with Google Tag Manager, here’s how you can enable the JS console there. In the top right corner of the browser, click three dots, then navigate to More tools > Developer tools.

A pane will appear at the bottom of the screen (or in the sidebar; this depends on your preferences). Switch to the Console tab, click Clear Console, and refresh the page. If you notice any red errors, consult with your developer about whether they are critical. The variety of errors is huge, so don’t think I can give you some tips on how to act in the most standard cases.
If you notice that an error is originating from gtm.js, then take a deeper look at it (because that is something caused by Google Tag Manager).

It’s also worth consulting with developers if you get some errors there. They might give you more insights (and, hopefully) solutions.
#17. View the Data Layer by entering “dataLayer” in the console
Even if you don’t have access to the website’s Google Tag Manager container and cannot enable the Preview and Debug mode, you can still check what is happening in the Data Layer. This is very useful if you’re asked to debug a particular issue quickly but, for some reason, cannot get access to the GTM container right away.
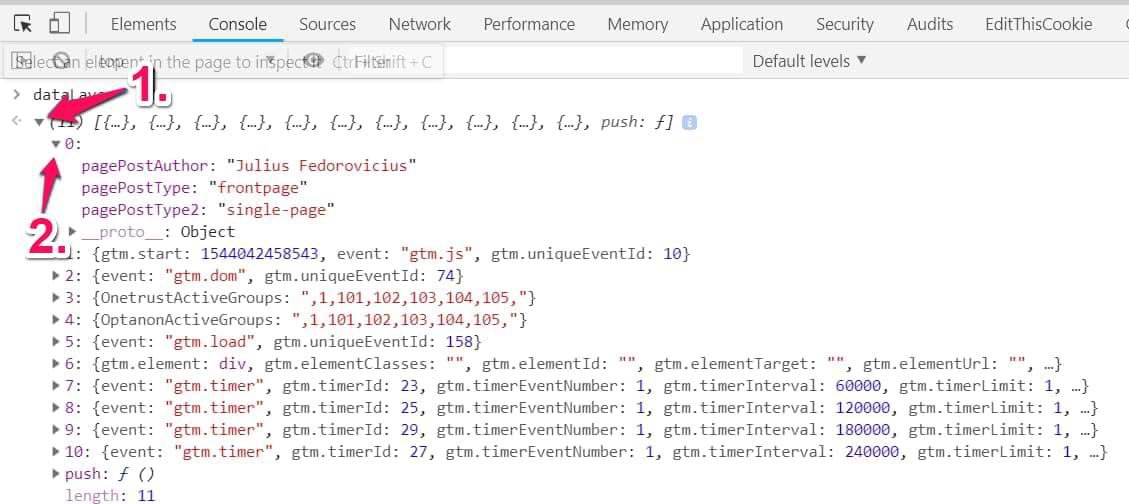
To do that, open your browser’s JavaScript console and enter the dataLayer. What you’ll see is the list of all the information which was pushed into the Data Layer.

Click the triangle to expand the Data Layer and then click any other triangle to expand that particular dataLayer.push() to see what’s happening.
However, it’s really important to understand that this dataLayer is not the same as the data that gets captured by Google Tag Manager’s data model. I know this sounds confusing, but if you want to go advanced, you’ll need to do that. Simo Ahava has posted a blog post about the GTM Data Model here. If you want to know access to the exact values that Google Tag Manager sees in the Data Layer, use methods described in tip #19.
#18. “Tag Fired” ≠ data was properly sent to a 3rd party tool
Even though a tag is displayed among “Fired” in the GTM Preview and Debug mode, this does not mean that the data was sent to another tool (e.g., Google Analytics or Facebook Pixel), as you expected.
It is pretty common among beginners to assume that if a tag has fired, the job is done here. Even if that happened, the request might end with an error (404, 502, etc.). Or maybe the request was indeed sent properly, but the values of your variables were undefined.
So how can you make sure that the data reaches its destination as you intended? There are several options:
- Check real-time reports or debugview if they exist in your tool of choice.
- For example, in GA4 real-time reports, you can debug events and conversions. When your tag is fired in the Preview and Debug mode, go check the real-time reports and see if the data is actually displayed here. Keep in mind that custom dimensions, custom metrics, e-commerce data are not available there.
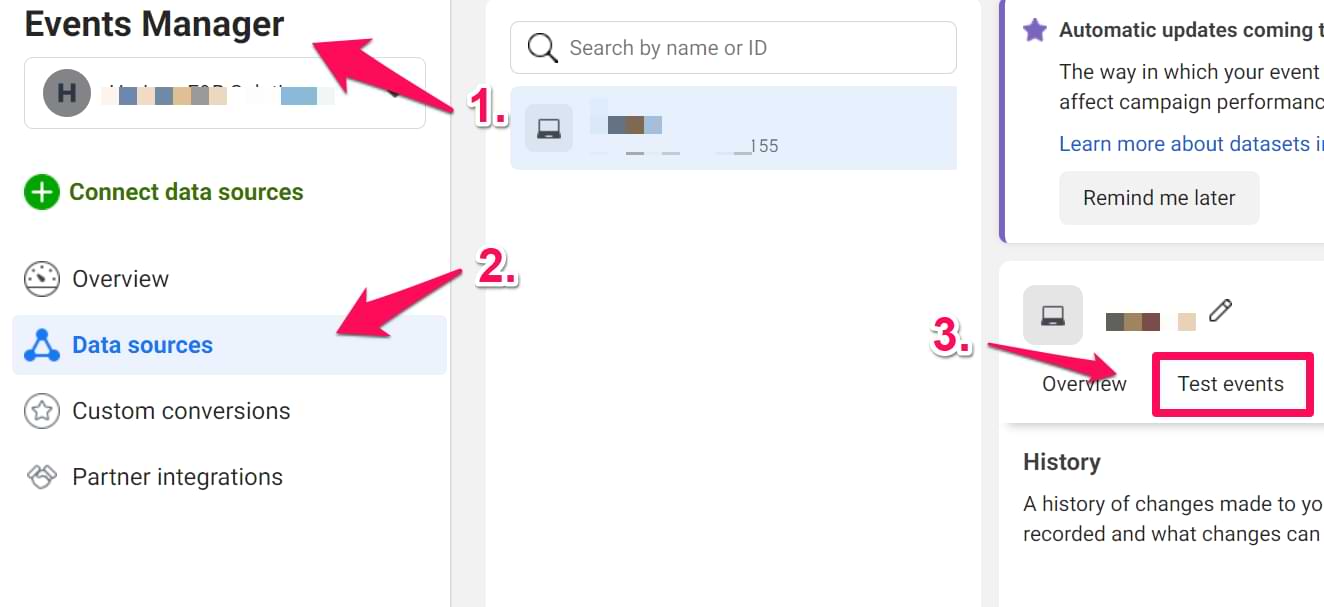
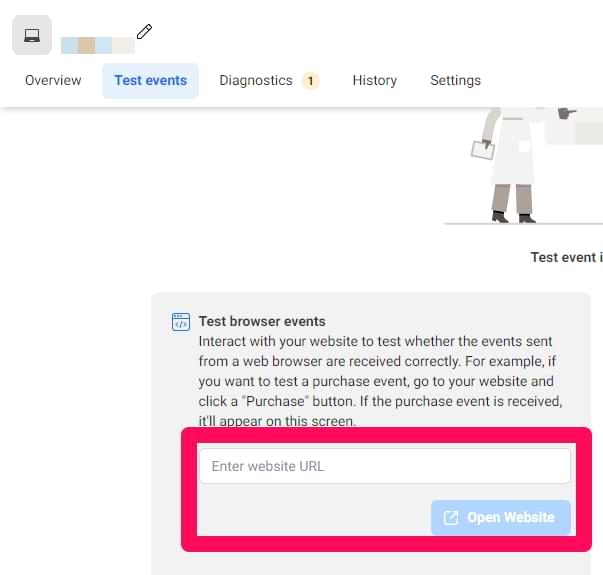
- As for the Facebook Pixel, you can also check their real-time data in Facebook Events Manager. Go to Events Manager, and navigate to Data Sources. Click on the Test Events tab, and begin debugging your website there.


- Check the Network tab in your browser’s Developer Tools. In developer tools, go to the Network Tab to see the list of requests that your browser has made on that page. You can locate a specific type of request by using the filter feature. For example, if you’re debugging Facebook Pixel requests, enter facebook.com/tr/ to see the requests sent by Facebook Pixel. If status codes are 200, this means that everything is great. Sometimes internal redirects are possible, so the 307 status code is also fine, as long as you see other requests getting the 200 OK.
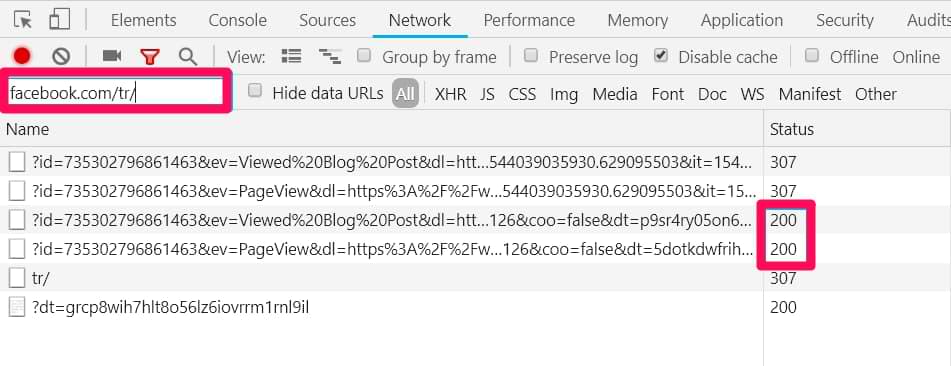

Read Simo Ahava’s guide, where he explains this topic more in-depth. - Use helpers (browser extensions) tailored to debugging particular tools/platforms. I will dig deeper into this topic a bit later (in one of the upcoming chapters of this blog post). But when I say “helpers”, I’m talking about Facebook Pixel Helper, Twitter Pixel Helper, GA Debugger, etc.
#19. Check if there are more website elements matching the same CSS Selector
If you’re actively tracking clicks and other interactions by using element IDs, CSS Classes, or Matches CSS Selector operators in GTM, you’ll find this one useful. By employing HTML element attributes and/or operators in their GTM triggers, people often assume that those attributes/CSS Selectors are pretty unique and apply only to those elements that they wish to track.
Well, usually, that’s not how things work.
The problem with this approach is that people cannot be 100% positive that those classes, IDs, etc., are unique enough to rely on. What if you want to track clicks of one element with a CSS class btn-bt? How can you be sure that you’re not setting a trigger that will cause many false positives?
In fact, there is a decent chance that there are more elements on that page/website with a similar CSS class. So if you’re checking your analytics reports and wondering why a click was tracked on a certain page (even though the page does not contain THAT SPECIAL ELEMENT), this tip is for you.
Let’s continue with the aforementioned example, CSS class btn-bt. In order to know the number of elements that utilize this class, open the JavaScript console in your browser’s developer tools and enter the following command:
document.querySelectorAll("your_css_selector")
Replace the your_css_selector with the actual CSS selector you wish to test against. In our case, the selector is “.red-block”.
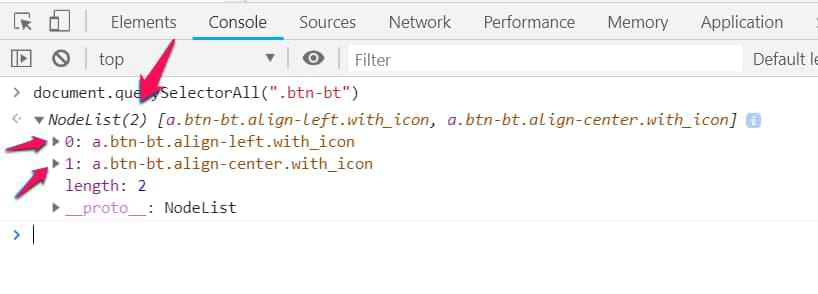
document.querySelectorAll(".btn-bt")
Hit enter. What you’ll see is the list of all the elements on a page that use this class. In the example below, I got two elements. You can tell that from the number next to the NodeList, and if you click the triangle next to it, you’ll see the list of all HTML elements that use that btn-bt CSS class).
To make use of this method you need to possess at least some basic knowledge of CSS selectors. Simo Ahava’s guide is very useful here.
How many elements do you see after you launch this command? Is that the result you expected? If not, then try narrowing down the CSS Selector to pick the item you are actually interested in.
The most common CSS Selectors for beginners are:
- .class
- #id
- parentElement > directChildElement
- parentElement descendant
- And if you want to dig a bit deeper, read Simo’s guide.
I also explain this tip here:
#20. google_tag_manager[‘GTM-XXXXXX’].dataLayer methods
If you want to access values stored in Google Tag Manager’s data model from outside GTM, you can use the google_tag_manager interface.
google_tag_manager[‘GTM-XXXX’].dataLayer.set(‘key’, ‘value’) sets the value of keyName to someValue in GTM’s data model. This is the equivalent to using dataLayer.push({‘key’: ‘value’});
google_tag_manager[‘GTM-XXXX’].dataLayer.get(‘key’) fetches the value stored in GTM’s data model for the variable name key.
google_tag_manager[‘GTM-XXXX’].dataLayer.reset() clears GTM’s data model and removes all stored keys.
As for debugging, the most useful here is google_tag_manager[‘GTM-XXXX’].dataLayer.get(‘key’) because you can quickly find out what should be the correct value of your Data Layer variable (without having the need to constantly update the actual variable in the GTM UI and refresh the preview mode).
I bet that this still looks confusing to some of my readers. No worries! A bit more visual explanation of this can be found in MeasureSchool’s video (starts at @1:07), and at @5:07, you’ll learn about one of the ways where you can apply this in practice.
Too many Google Tag Manager debugging tips at once? No worries. Just bookmark this guide and come back at your earliest convenience.
Part III: Google Tag Manager debugging with browser extensions
A whole bunch of time-savers that will make your work much easier.
#21. Inject your Google Tag Manager container with extensions like dataLayer Inspector+
When you create a new Google Tag Manager container, a developer must add its code to the website’s source code to make it work. But what if they are busy and can do that only after a few days? With injector extensions, you can emulate your GTM container on any website and then continue working/configuring GTM without any disruptions.
One of those extensions is dataLayer Inspector+
When you temporarily inject your container, you can already configure your setup. And when a developer finally actually installs your container to the website’s source code, your container setup will be ready.
#22. Even more cool features of dataLayer inspector+
AnalyticsPros have created an amazing browser extension that can be used as a Swiss army knife in Google Tag Manager debugging and testing. Not only can it inject your GTM container, but there are also other goodies at your disposal.
If you want to learn more about its full capabilities, read this guide and this one.
To name a few out of many awesome (and very helpful) features:
- Visually visible requests to Google Analytics in the browser’s JavaScript console.

- Timing. You can tick the checkbox to see how long it takes GTM to process a hit from the dataLayer push to the eventCallback.


- Validations (for example, missing keys in an E-commerce object. See the screenshot below)


- As previously mentioned: Data in the Data Layer is preserved across multiple pages (see tip #6).
- One more useful feature became a separate tip in this blog post. Continue reading.
#23. Block already existing GTM containers in order to inject your own. Fresh and clean.
This tip is related to the aforementioned dataLayer Inspector+. I did not want it to blend with just a mention of the extension, so I created it as a separate tip.
Here’s the situation. Someone asks for your help to debug an interaction with the GTM on a particular website, which already has its own Google Tag Manager container. For some reason, you cannot quickly get access to the original container. This is where you decide to inject your own (for testing purposes).
Even though you cannot see in your Preview and Debug mode’s original container’s content, you’re still able the monitor what’s happening in the Data Layer and play around with the website itself.
The original container actively uses the Data Layer and keeps pushing some data that is messing around with your container. This makes the debugging inconvenient as you see events that should not be seen in your container.
What’s the solution? You could temporarily block the original container’s script so that it would not interfere with your debugging efforts. Luckily, dataLayer Inspector+ offers a neat feature called Block & Swap Script.
Open dataLayer Inspector+ > Inspect > Advanced Options > Block & Swap Script and paste the old GTM container’s ID.
The plugin will be looking for all the scripts on a page that contain that string (your GTM Container ID) and will block them.
That way, the original container will not mess with your debugging. Again, this is happening only within the boundaries of your browser. Therefore, you’re not affecting other visitors.
#24. GA Debugger
This extension is useful if you want to dig deeper into what data was passed onto Google Analytics. Once installed and enabled, it enables GA’s debug mode that starts displaying the data in the browser’s JavaScript console (among other Developer Tools).
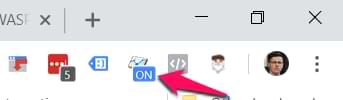
To enable it, simply click the extension’s icon, and you’ll see the ON badge. This indicates that the GA Debug mode is enabled, and you can start checking the data.
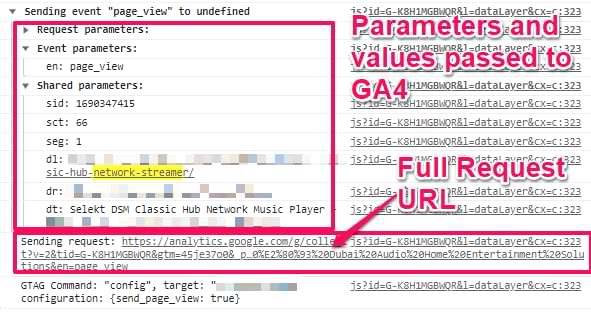
After the extension is enabled, open the browser’s JavaScript console and refresh the page. You’ll start seeing all the requests that were sent to GA.
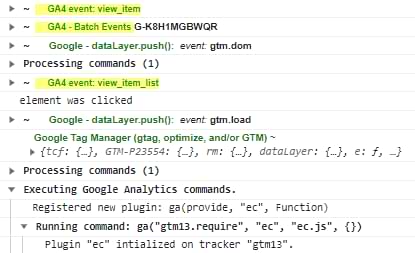
Even though the info might look too technical, this is definitely worth checking out as it (more or less) clearly displays all the parameters that were passed to Google Analytics. Every GA4 event is visible as a separate table with all the parameters and their values.
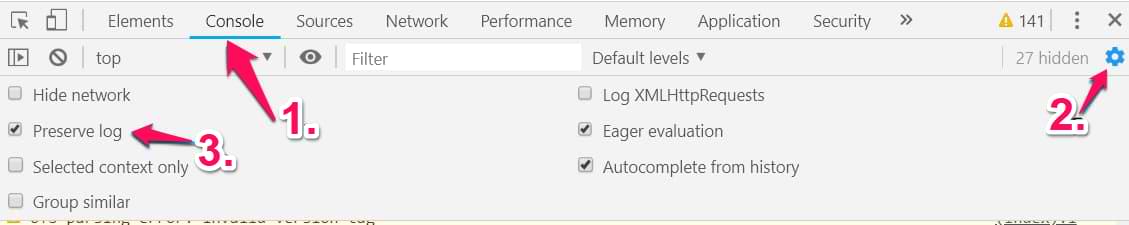
By default, the browser’s console is cleared every time the page reloads. So if you want to preserve what was captured, enable the Preserve Log setting:
#25. Analytics debugger
Yet another fantastic GTM-related Chrome extension, this time developed by David Vallejo. It adds an additional tab to your Chrome browser’s Developer Tools, easing your Google Tag Manager debugging process.
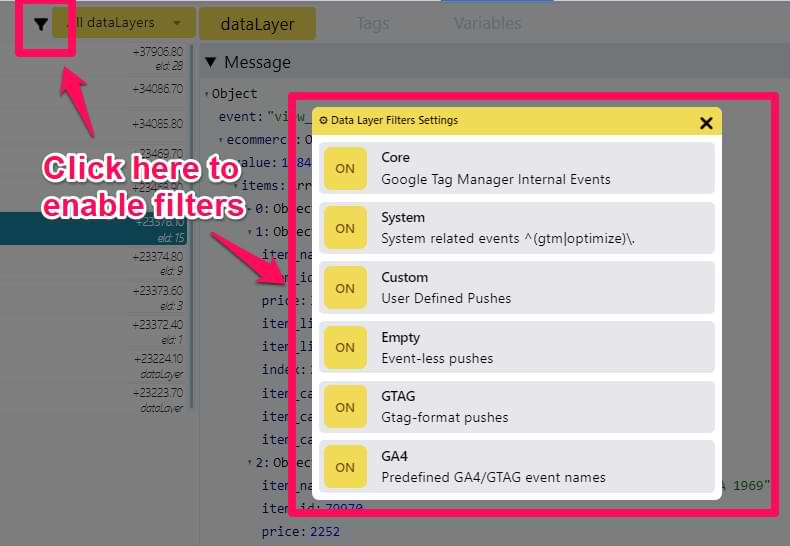
First, the extension displays (in a readable manner) the data pushed to the Data Layer and the current data stored there. If you want to copy the Data Layer (e.g., send the snippet to a developer (to report a bug)), you can do with a couple of clicks.
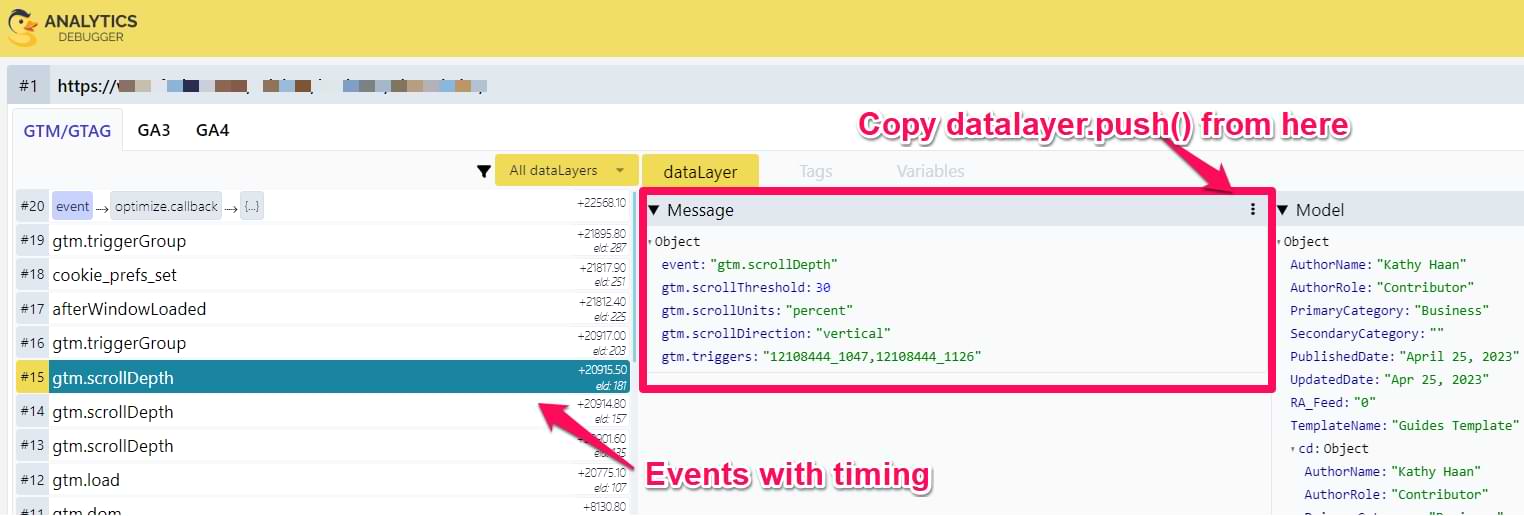
You can view all triggered events related to ecommerce activities on the website. Click on a specific event, and you’ll get a complete breakdown of the information being passed.
And if the website (that you’re working on) tracks A LOT of events, it might be a good idea to filter them out and track only particular types.
At this moment, David is actively updating/improving the extension; thus, I’m sure you’ll find some new features there pretty soon. I still catch myself discovering something new (and pleasant/convenient) there.
#26. Use helpers/debugging plugins tailored to specific tools
I’m talking about Meta Pixel Helper, Twitter Pixel Helper, and other similar plugins tailored to particular tools. These browser extensions let you easily debug the data passed to 3rd party tools and whether that data was correctly formatted.
For example, once you install the Facebook Pixel helper and load a page where the pixel is present, you’ll notice that the extension’s icon has become active.
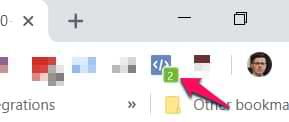
Click it to see the detailed view of the information captured and transferred to Facebook’s servers.
If tracking issues occur, the extension will display that in a readable manner. Once you fix the problem, refresh the preview and debug mode. Then the page and revisit the plugin’s report again to check if that helped.
Part IV: Other GTM/GA debugging tips
Everything else that I could not find a place to.
#27. Don’t see the data in GA4 Real-time reports? There are several possible reasons
So you’re debugging Google Analytics implementation, checking real-time reports, but, for some reason, cannot see the data coming in. Why?
- You (or someone else) might have inserted the wrong GA4 tracking ID for your data stream.(which you shouldn’t)
- GA filters are involved (most often, IP-related filters are the ones to blame)
- An opt-out extension activates in your browser.
- An ad blocker is preventing GA4 from receiving the data from the website. Privacy-related extensions (like Ghostery and AdGuard AdBlocker) are becoming increasingly common among users.
- You forgot to publish the GTM container, where your GA4 property is configured.
- The website has a content security policy that blocks GA4’s data collection.
I have posted an in-depth guide explaining these reasons and how to solve them.
#28. It is possible to test GTM implementation (web) on a mobile device
If you want to check what’s happening in the Preview and Debug mode while on a mobile device, just enable the P&D mode on your desktop/laptop, click Share Preview, and copy the generated link (don’t forget to enter the Destination URL for easier access).
Send that shared preview’s link to a chat/email/whatever so you can open it via a mobile device.
That’s it! Now you’ll see the Preview and Debug mode.
Of course, it won’t be the most pleasant experience, but working is still possible. Pro tip: consider enabling Desktop view in your mobile browser to see more of the debug console.
To exit the debug mode, revisit the shared preview link and click Exit.
Update: Jean (in the comments of this blog post) also suggested an alternative solution: It is possible to test GTM implementation (web) on a mobile device. You can simply activate the Toggle Device Mode in the Chrome Dev console or Ctrl + Shift + M (while the Console is open). I use it to check that my tags fire only on a mobile.
Google Tag Manager Debugging: Final words
Whew! That was a long one! As you can see, there are many things to know and/or try when it comes to Google Tag Manager debugging. Although some of these tips are related purely to Google Analytics, GA4 is the most common 3rd party tool users configure within GTM. So I guess it’s fair enough.
The key takeaway here (especially for beginners) should be that GTM debugging involves more than checking if a tag has fired. That’s just the beginning. You also need to make sure that:
- The data/request was sent successfully (e.g., via the Network tab or some browser extension)
- And it is correctly displayed in the 3rd party tool (e.g., Facebook Pixel, Google Analytics, etc.)
- And also, there are a lot of different testing/debugging tools you can choose from. So pick the ones you find the most suitable/convenient, and hunt those bugs!
The list of these tips is far from complete. So whenever I remember something else (that is useful) or if you have some GTM debugging tricks up your sleeve, feel free to share it in the comments, and I’ll probably add it to the guide.
13 COMMENTS
#32. It is possible to test GTM implementation (web) on a mobile device
You can simply activate the Toggle Device Mode in Chrome Dev console or Ctrl + Shift + M.
I use it to check that my tags fire only on mobile.
Thank you for the great tips.
Thanks for the suggestion! I'll add it to the list.
Hey Julius,
This is a very comprehensive list. I'm at the opposite end of GTM to you, just getting started. I've added it to two sites and used it to add GA tracking codes. On one of my sites the GTM debug window keeps appearing (because I'm logged into the site doing development). Its a complete pain in the back and I have tried everything to turn off debug. When I visit the GTM console everything looks fine and it does not say that it is in Preview or Debug mode.
I wondered if you had any ideas?
Cheers,
John.
Hey, try checking the tip #3 once again.
You are a life saver! Thank you!
I am definitely book marking this page.
Hi Julius, Thank you for the tips! We are experiencing memory leaks on our React SPA site due to the history of information pushed in the dataLayer (an example of what i'm referring to are your images under tip #16). Specifically, every gtm.click event has a gtm.element object that retains DOM elements and after about 20 clicks, our site crashes. Clearing the dataLayer (window.dataLayer.push(function() {this.reset();})) does not seem to clear the history of stored gtm.clicks. Do you have any ideas as to how to truly clear the dataLayer?
Yes, read tip #19
Thanks for the response. Unfortunately, google_tag_manager[‘GTM-XXXX’].dataLayer.reset() clears the data model but not not the dataLayer. When I view the dataLayer after running the command in the console, the history of previous events is still there.
What I meant is that you can clear the model and also clear the dataLayer. The reset method is (as you said) in for the data model. And additionally, you could loop through the dataLayer array and remove every object there (just make sure you don't remove the modified .push method).
You can use tag sequencing in order to activate a tag with your custom code (that clears the DL array) that clears the data layer.
Hi Julius, great tips here. I've followed this tutorial (& the one on youtube as well) & have fixed my problems to * some * extent. Using the data layer inspector extension, I found out that some of my tags fired twice although it showed only one dataLayer push. What might be causing this?
Difficult to say without doing an audit. Maybe you have hardcoded tracking codes too, maybe something else is misconfigured.
Hello Julius,
Have you had any experience with problem:
I have set up the element visibility tracking - everything works fine while in debug mode (both in tag manager window and in analytics aswell - the goals that i have set up - are working and triggers are firing)
The problem comes when i close the debug window and try to test the goals once again. When scrolling through the website and stoping on that element which i have set up tracking - the event does not fire.
do you have any ideas on how to solve this?
i definitely published the changes that were done and everything should be working properly
Difficult to provide an answer without doing an audit