
January 3, 2026
Path Exploration report in Google Analytics 4
Updated: January 3rd, 2026
Exploration reports in Google Analytics 4 are a suite of features that allow you to dive deeper into your data. In the past, I have explained how to work with Free Form reports and Funnel Exploration. This time, let’s look at another type of report, Path Exploration.
In the older versions of Google Analytics, behavior flow reports were quite limited (that’s why I rarely used them). However, with GA4, the improvement is noticeable. Even though Path Exploration is imperfect, and there is more room for enhancements, you can already achieve more with it than with flow reports in GA3.
In this blog post, I will show you how to use them and share several ideas of what you can analyze next.

Table of Contents
– Here’s what you will learn in this article –
- What is Path Analysis?
- #1. Overview of the interface
- #2. Examples of Path Analysis
- #3. Ideas of what to analyze next
- Final words
Other Exploration reports in Google Analytics 4
I have also published several other related blog posts that you might find helpful:
Video tutorial
If you prefer video content, look at the tutorial from my YouTube channel.
What is Path Exploration in Google Analytics 4?
Simply put, you can see how your users/visitors use the website/app. You can see what kind of events/pages occurred first, and if you click on a certain branch, you can see what pages/events occurred after that.
This can help you understand your users’/visitors’ paths after completing specific actions.
If it’s still not quite clear, don’t worry. In the second half of this blog post, we will look at practical examples.
#1. Overview of the interface
In this section, I will show the features that you can use. Later, you will learn how to apply them in practice.
To start, log in to your Google Analytics 4 property and click Explore (on the left sidebar). Then select Path Exploration.
The interface of the Explorations is split into three main parts/columns:
- Variables
- Tab settings
- The output (the report/visualization that is generated based on your configuration)

Let’s take a closer look at each part.
#1.1. Variables
This has nothing to do with Google Tag Manager’s variables. The Variables section in the GA4 Exploration reports is the place where you select data that you plan to use in a report:
- Date Range
- Segments
- Dimensions
- Metrics
Also, you can change the name of the exploration in the top-left corner of the interface.

To select a different date range, click the date in the top-left corner (below the exploration name) and select whatever you need (like “last 7 days”, “Last 30 days”, etc.).

#1.1.1. Segments
If you want to see how different groups of your users/visitors behave, you should include those segments in the Segments section first (I will later show how to add them to the actual path exploration).
You can choose from several segments that are already included, or you can add your own. You can do that by clicking the plus icon:

Then you can either create a custom segment or select a suggested one.

Speaking of custom segments, there are three types:
- User segment where you can include data of all users that match certain user criteria. Example: show all events of users who are from the US. This is equivalent to user segments in Universal Analytics.
- Session segment where you can include data of sessions that match certain criteria. Example: show all events of sessions where visitors downloaded an ebook. This is equivalent to session segments in Universal Analytics.
- Event segment where you include ONLY events based on certain criteria. This was not available in Universal Analytics. Example: Show data only of those events of which name is page_view or session_start.
#1.1.2. Dimensions and metrics
Dimensions in Google Analytics are parameters/attributes of an event, product, transaction, user, etc. They are attributes that describe something. For example:
- Event name
- Transaction ID
- User’s pricing plan
- Product category, etc.
Metrics help us measure. For example, how many events were made yesterday, how many transactions were completed last week, etc.
Speaking of the actual metric names (and examples) that you can find in GA4, here are some examples:
- Event count
- Number of active users
- Number of transactions
- Engagement rate
However, at the moment of writing this blog post, Path Exploration supports only three metrics:
- Active users
- Event count
- Total users
Now that we have some basics, here’s the catch in the GA4 Explorations. If you want to use a metric or a dimension in any exploration technique within that report, you have to include the dimension/metric in the Variables column first. You can do that by clicking the Plus icon and then selecting what you need.
After you select the needed metric/dimension, click the Apply button in the top-right corner.

As I’ve said before, you cannot add more metrics to your Path Exploration, they will all be greyed out.
To sum up, the Variables column is responsible for the data input. If you want to use some segments/metrics/dimensions, they must be included in that column. If you miss something later down the line, you can add new items on the fly. Also, you can change the date range (which, obviously, also affects the scope of data input).
#1.2. Tab settings
In this column, you can configure what the report will look like. First, there is a Technique drop-down menu (where you can select from things like Free Form, Funnel Exploration, etc.). In this blog post, I focus only on the Path Exploration part.
#1.2.1. Segment
Here, you can add one segment to analyze only a certain subset of your data. The comparison here (like Exploration reports) is not available.
#1.2.2. Node type
Unfortunately, you cannot change anything here. This part shows the types of nodes that you can use in the report.

What is a node? Every branch in the path exploration visualization is a node. At the moment, the data can be split by Event name, Page title and screen name, Page Path, or Page title and screen class.
#1.2.3. View unique nodes only
Below the Node type, there is a View unique nodes only switch. It’s easiest to explain this feature with an example. Imagine that a visitor lands on your website, and you track the following events in this exact order:
- session_start
- page_view
- page_view
- view_promotion
If that toggle is disabled, it means that identical subsequent event names (or pages/app screen dimensions) will also be shown. Then the flow will look like this: session_start -> page_view -> page_view -> view_promotion.

If you enable the View unique nodes only, then several subsequent events will be ignored, and only the first one will be shown. Having the aforementioned 4 events in mind, the flow will look like this: session_start -> page_view -> view_promotion.

#1.2.4. Breakdown
In this section, you can add one dimension to break down your paths. This is more powerful than it looks.
For example, add the Device category dimension to the ‘BREAKDOWN’ box. The path nodes will now show colored bars representing the share of Desktop, Mobile, and Tablet users for that specific step.
At the bottom of the visualization, you will start seeing a legend. Click on the one that you are interested in, and it will be highlighted.

#1.2.5. Values
Here, you can add a metric that will be displayed (as numbers) in the path exploration visualization. As of the moment of writing this blog post, three metrics are supported:
- Active users
- Event count
- Total users
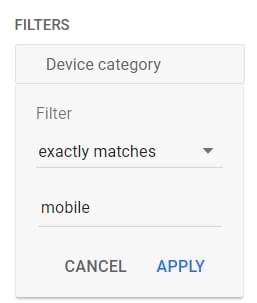
#1.2.6. Filters
You can add filters that will be used to narrow down a subset of the data that you are analyzing. However, I’ve noticed some quirky behavior here.
Here is a situation that I wanted to achieve.
I wanted to see only certain events in the path exploration, page_view, session_start, and purchase. Unfortunately, I was not able to make it work. Even if I added one filter Event exactly matches page_view, the output of the report was empty.
If you, like me, want to narrow down just to a certain list of events, create an Event segment instead (where you narrow down to just certain events). See the screenshot below.

However, a filter where I narrowed it down to only mobile users worked well.
#1.2.7. Node filters
If you want to exclude a certain node in your visualization, right-click on that node’s name and then Exclude node. Then you can select either to exclude it from all paths or just this one.
That filter will then be added to the Node filters section.

#1.3. The Output (report)
Once you configure all the necessary things in the Variables and Tab Settings columns, the path exploration visualization will be visible. Here, you can do several things.
Add new tabs if needed. Every tab can use a different exploration technique (free form, funnel exploration, etc.). Also, duplicate and delete them by clicking the Triangle icon next to a tab name:

Start over, undo, redo, share the report, and download the report:

Clicking Start over will unlock a long-requested feature, reverse pathing. In GA3, it was only possible to create flow reports from the beginning (e.g., when someone lands on the homepage).
In GA4 path exploration, you can start from the end (e.g., when someone subscribes to your newsletter). Then, you can see what events/pageviews occurred before a visitor subscribed. This can give you some hints and a better understanding of what happens.

#1.3.1. Navigating the Path Exploration report
When the path exploration visualization is ready, click on a branch you are interested in. Then you will see what visitors did next. Under the page title or event name, you will see a metric. This metric is based on what you have selected in the Values section of the Tab settings.

If you want to change the starting point (for example, you need a different event or page), you will have to click Start over. This will clear the visualization (but your Variables and Tab Settings will remain unchanged).
Speaking of all the other columns in the visualization, you can change their types. For example, instead of Event Name, you can select Page Title and Screen Name.

If you don’t want to see certain nodes in a particular column, you can click the pencil icon above it and then uncheck events/pages/screen names that you don’t want to see.

Then those values will be hidden in the bottom branch (a.k.a. More).

In Path Exploration, you can have up to 10 columns. This means you can analyze a path that is 10 steps long (e.g., your ‘Starting Point’ + ‘Step +1’ through ‘Step +9’).
If you want to start from the end (a.k.a. reverse pathing), you will need to click Start over. Then click on the Ending point and select whether the initial column will be based on the event, page title, or some other dimension displayed there.

#2. Examples of Path Exploration
Enough of the theory. It’s time for some practical stuff. I will use the official Google Analytics 4 demo account in this demonstration. It lets you play around with real data from Google’s Merch Store.
If you want to get access to it, too, click this link and then click ACCESS DEMO ACCOUNT.
If you are unsure how to use the demo account, watch this quick tutorial.
#2.1. What happens in the checkout after the begin_checkout event
If you have implemented GA4 e-commerce tracking (you can learn how to do it in my Intermediate/Advanced GTM course), you will start collecting the begin_checkout event sent every time a visitor starts a checkout.
Let’s look at what your visitors do when this event is fired.
First, click Start over in the top-right corner of the exploration. Then select the Event name in the starting point.

Then a sidebar will appear on the right side. Select begin_checkout.
Out of curiosity, let’s disable the View unique nodes only option.

This is a friendly reminder that I am doing this example in the GA4 demo account. When you do this, the data will be different (because we are working with different date ranges).
Now, I will click the first begin_checkout. I see that the next event is page_view, but there is one more event hiding under More, and the event count there is even larger. I’ll click it.

Another begin_checkout event? Let’s click it.

One more begin_checkout event. That’s not good. Either the tracking setup on the Google Merch store is incorrect or something is wrong with the actual checkout.

In these cases, I usually start doubting the tracking setup. Things can easily break (or maybe they were never correct in the first place).
So, I decided to start checking out on Google’s merch store and check the browser console with Data Layer Inspector. When the checkout begins, many of the same events are sent to the same GA4 property.

The best way here is to contact the website developer (who is responsible for managing dataLayer.push codes) and ask him/her to fix it. Only one begin_checkout event should be sent to GA when a visitor starts to checkout.
And I could identify this with the help of Path Exploration in Google Analytics 4.
#2.2. An example of a reverse path exploration report
In my YouTube tutorial about path exploration, I also share an example of reverse pathing.
I saw that Google’s merchandising store had many error events tracked. So I clicked Start over, selected the event errors as the ending point of the exploration, and then checked what users were doing before it.
Turns out there was a broken link on the homepage that redirected visitors to a “Page not found” error. That error was the most popular event that people were doing after they landed on the homepage. Yikes!
You can watch the YouTube video with that path exploration example here.
As another example, you can see what visitors did on your website before purchasing. To do that, create a new Path Exploration report and click Start over at the top-right corner.

Click Ending point and then select Event Name.

You can also choose the Page Title (if you want to see what people were doing before visiting a particular page).
In this example, I will select the event purchase. It might be helpful to use the search feature.

And that’s it! You can now drill down and see what visitors were doing before purchasing.

If you want to see the previous pages (rather than the event name), you can click the dropdown field at the top of the step and switch from the Event name to the Page title and screen class.
#2.3. Example: Comparing ‘Mobile Traffic’ vs. ‘All Users’
Let’s see how different segments behave. In your ‘Variables’ column, add a ‘Mobile traffic’ segment (it’s often included by default ).
- Build a path you want to analyze, for example, a reverse path starting from the purchase event (as shown in section 2.2 ). This path initially shows data for ‘All Users’.
- Now, in the ‘Tab Settings’ column, drag the ‘Mobile traffic’ segment from your ‘Variables’ column into the ‘SEGMENT’ box. The report will update to show the purchase path for only mobile users.
- Compare the nodes and event counts to your ‘All Users’ path. Do mobile users follow a different path to purchase? Do they use site search more or less?
- To compare “side-by-side”, you can duplicate the tab. Keep ‘All Users’ on one tab and apply the ‘Mobile traffic’ segment to the second tab. This allows you to flip between them to spot key differences in behavior.
#3. Ideas of what to analyze next with Path Exploration
If you are looking for more inspiration for what to analyze next with Path Exploration in Google Analytics 4, here are several ideas. I won’t be diving deep into their actual configuration, but I believe that after reading this blog post and watching the tutorial, you should be able to do this yourself.
Idea #1. What are your visitors doing once they land on your homepage?
Idea #2. What are your visitors doing during checkout when they face an error? You can create a session segment where there is one event named begin_checkout and then the other event called errors (or whatever the name of the event you use). Remember that neither begin_checkout nor errors are automatically tracked events. You will need to configure them manually.
Idea #3. What are your visitors doing before they subscribe to a newsletter? Let’s say that every time someone subscribes to your newsletter, a generate_lead event is sent to GA4. Then, you could select that event as the ending point of the path exploration and go backward. Learn the most common behavior of your visitors/users in this case.
Idea #4. What do your users do after they log in? But for that, you would need to implement login tracking. Ask a developer to push the login event to the Data Layer every time a user logs in. Then, send that event to GA4. If you want to learn more about custom event tracking with GTM and GA4, my course for beginners is exactly what you need.
Idea #5. What do users do after adding an item to the cart? Hint: This is a forward path. Click ‘Start over’, select ‘Starting Point’, choose ‘Event name’, and select the add_to_cart event. The next steps will show you if they proceed to checkout (begin_checkout), view more items (view_item), or abandon the journey.
If you want to get even more ideas and learn Google Analytics 4 well, look at my Google Analytics 4 course, where you will learn:
- How to properly plan analytics and GA4 setup (and how to find what is important to track)
- How to configure Google Analytics 4 property
- How to collect data and create reports
- How to get insights out of the data you have

Path Exploration in Google Analytics 4: Final words
Path exploration has some improvement compared to the previous version of Google Analytics (where we had Behavior Flow). Just the ability to do reverse pathing is worth a try. As you start using it, remember these key points:
- Use reverse pathing: The ability to start from an ending point (like a purchase or generate_lead event) and see what users did before is one of the most valuable features. Use it to understand successful conversion paths.
- “View unique nodes only” is key: By default, this is enabled to simplify paths. Turn it off (like in our begin_checkout example) to see all sequential events, which is useful for debugging duplicate tracking.
- Filter with segments: If event name filters behave strangely, use an Event Segment to isolate the specific events you want in your path.
- Use it for debugging: As our checkout example showed, this report is one of the best ways to spot data quality issues, like duplicate events firing incorrectly.
If some of this blog post’s content was difficult to follow, I recommend watching my Youtube tutorial. Topics like these, in my opinion, are learned best when you combine text + video.
11 COMMENTS
This is an absolutely perfect blog post.
Many Thanks.
Hello Julius. Thank you for this article, it's very helpful. I've yet one doubt about the node types: when we choose the node type "page title" (with screen name or class), the page titles shown correspond to the page title of page_view events?
My question resides in the fact that i'm introducing web analytics to a spa website, and i'm trying to analyse user's path sending manually the page_view events from GTM.
I would love to be sure that the page titles are extracted from page_view events. Thank you very much !
Hi, I am not 100% sure. Page title is tracked with every event, so I would not be surprised if they are coming from all events in the path exploration report.
Hey Julius, is there a way to the % of users who took a path, rather than the total #? Thanks!
*show the % of users
Hi, no
Okay, thank you!
Is there a reason why if "view unique nodes only" is toggled off, that the same value (event name or page path) would appear subsequently?
Hi, thanks for this post. Very useful. I want to use the path exploration report to understand which pages users are landing on, their journey through the site till they exit. It would also be great if I could have drop off percentages on each step.
Is it possible to create a report like this in GA4? I don't want to pre-define a journey.
Thanks
yes that would be nice, just like in GA3