
January 2, 2026
A Guide To Google Tag Manager Preview Mode
Updated: January 2nd, 2026
Why doesn’t my tag fire? What data can I send to Google Analytics? Why didn’t this trigger work?
When it comes to Google Tag Manager, we sometimes run into trouble that requires further investigation of what’s going on. Debugging is one of the most important yet commonly overlooked steps in the GTM process. It ensures that every possible user experience scenario is tested and data consistency is validated.
Google Tag Manager preview mode is a built-in feature that lets you test GTM container on your own site before publishing the changes live. It opens a debugging console where you can see in real-time which tags are firing, what data is being collected, and why your triggers did or did not activate.
In this guide, I’ll show you how to utilize Google Tag Manager Preview mode (also known as Preview and Debug mode) and share some best practices.

Table of contents
Here’s what you will learn in this article
- “Old” vs “New” Preview mode. Why did it change?
- What Is Google Tag Manager Debug Mode?
- Enable Preview And Debug Mode
- The layout of the Google Tag Manager Preview page
- Refresh/Share/Exit
- Debugging multiple domains
- Enhancements with Tag Assistant Chrome Extension
- Common problems & solutions in preview mode
- If Google Tag Manager Preview mode is not working
- What is the ‘Message’ event in the timeline?
- A few More Tips
- Conclusion
What Is Google Tag Manager Debug Mode?
Google Tag Manager Preview mode (a.k.a. Preview and Debug mode, a.k.a. P&D) allows you to browse a site on which your GTM container code is implemented and preview which tags are firing, what kind of data they send to analytics/marketing platforms, etc.
When you enable the preview mode in the Google Tag Manager interface, you will end up with three browser tabs (or two tabs and one additional window):
- A tab with your Google Tag Manager interface


. - A new tab for tagassistant.google.com where is the actual preview console displayed

. - A new tab (or window) where you see your website and a preview mode’s badge at the bottom-right corner of the screen.


Why is preview mode needed at all? Because there is nothing worse than working with GTM blindly and trying to guess if your setup is working.
Google Tag Manager’s preview mode lets you:
- See which tags have fired on particular website interactions (e.g., a link click or form submission)
- Which tags did not fire
- The reasons why certain tags fired or didn’t fire
- What kind of variables (and their values) were available on the page
- How the Data Layer changed on the page when various interactions were happening, etc.
Personally, I usually never trust my gut when it comes to modifying my GTM setups. I always test them, even the minor ones. Because it’s the worst to find out (after several days (or maybe weeks)) that your recent change broke something in the analytics setup.
Always test. Then, Publish your changes live.
Now, let’s take a look at how the preview mode works and how to work with it.
Enable Preview And Debug Mode
To enable Google Tag Manager Debug mode, click the Preview button in the top right corner of your GTM interface (near Submit button).

Once you click the Preview button, a new browser tab will open with tagassistant.google.com. If it does not, read this guide.
A popup there will ask you to enter the URL which you want to test and debug. It might be the address of a homepage or it might be a specific page’s URL, and then press Start.

A new browser tab (or window) should appear where you will see the URL you entered in the previous popup. If the page does not work, try to enable the preview mode once again and then disable this checkbox in the preview’s popup:

At the bottom of that page/tab, you must see the following badge:
If you go back to the tagassistant.google.com tab, you must see this success message.

If you don’t see the success message or if the preview badge shows that the debugger is not connected, read this.
The layout of the Google Tag Manager Preview page
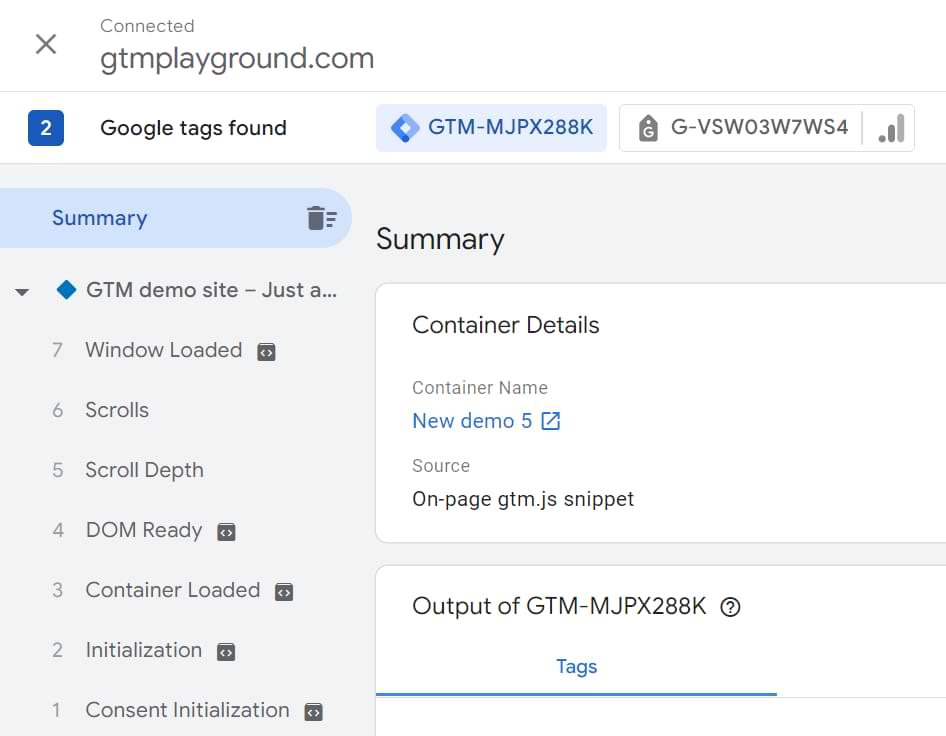
Google Tag Manager Debug mode (a.k.a. Google Tag Manager Console or just GTM console) consists of eight main parts:
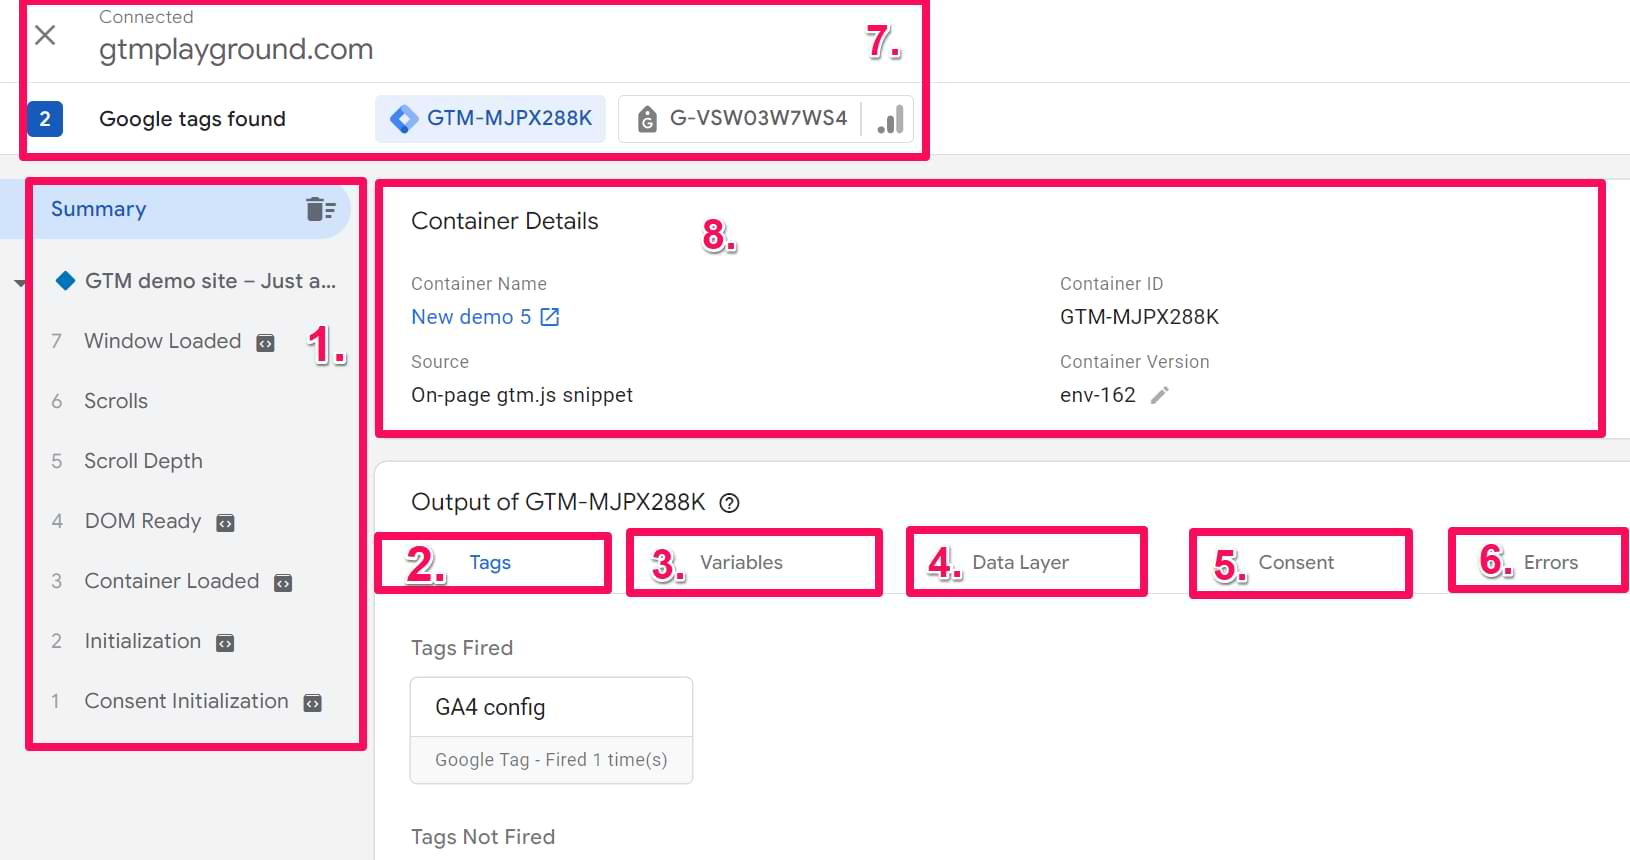
- Event Timeline. Displays all events in the Data Layer (e.g., page views, form submissions, clicks, etc.). One item = one event (a.k.a. dataLayer.push). Do not mistake them for Google Analytics events. These are two different concepts, which I have discussed in another blog post.
- Tags. Displays which tags fired on the selected data layer event and which ones didn’t.
- Variables. Displays detailed information about variables in the selected event, including the type of variable, the type of data returned, and the resolved value.
- Data Layer. Displays the exact message object as it was pushed to the data layer for the selected event and what the data layer looks like after the message transaction is complete. All data points available here can be turned into variables (which will appear in the Variables tab). Continue reading to learn more.
- Consent. It shows you the consent status if you are using Google Consent Mode.
- Errors. If you notice any number in the tab (rather than 0), click it and see the cause.
- Header. Here, you can see the status of the Preview mode (whether it is connected to the newly opened website window or not). Also, if you have Universal Google Analytics implemented via gtag.js or you are running Google Analytics 4 on your site, you will see a dropdown to switch between
- Container details. It shows you the name of the container, container ID, how the container is implemented, and the Conversion Version + Environment.
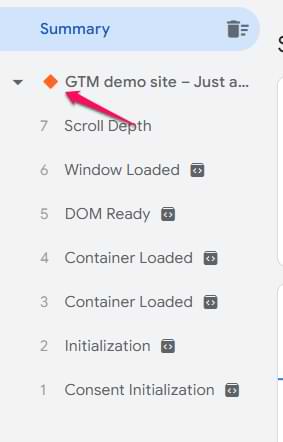
Event Timeline
All events in the data layer are displayed on the left side of the Preview and Debug console, Event Timeline. Every time a page loads, there must be five events displayed in the list – Consent Initialization, Initialization, Container Loaded (previously known as Pageview), DOM ready, and Window loaded.

If you see more events (for example, Message), that’s fine. But all five aforementioned events must appear on the list of every page.
If you’re missing the Container Loaded event, there’s probably a case of the broken data layer. I have published a blog post explaining the problem and the solution when the Container Loaded event does not appear in GTM P&D mode.
Also, when you navigate from one page to another on your website (that you are debugging), all events in the preview mode will be grouped based on those pages.

Why are there always five events on every page?
What do they mean?
Consent Initialization (a.k.a. gtm.init_consent) is the moment when you should load consent-related settings (e.g. you can load a cookie consent banner or Google Consent Mode tag).
Initialization (a.k.a. gtm.init) is the moment where you should fire main tracking codes that load JavaScript libraries on a page (needed for other tags), for example Google Tag (a.k.a. Google Config Tag).
Container Loaded (a.k.a. gtm.js) is the moment when you can fire pageview-related tags that are not configuration tags (e.g., not Google Tag). Previously it was the first event that happened in GTM, but now Consent Initialization and Initialization happen before it.
DOM Ready event (a.k.a. gtm.dom) occurs when the website’s HTML is downloaded, the page’s document is rendered, and a visitor starts to see elements of your website. Learn more.
Window Loaded event (a.k.a. gtm.load) fires only when everything else (including Javascript) finishes loading. Learn more.
What Are Other Possible Google Tag Manager Events?
Actually, the list of events is endless.
Google Tag Manager offers a list of built-in triggers, such as page view (including Page view, DOM ready, and Window Loaded), click (link click and click of any element), form submission, timer, history change, Javascript error, etc.
After a trigger is enabled, it looks for particular interactions on your website. For example, the Form submission trigger looks for form submissions, and the Link Click trigger waits for interactions when a visitor clicks any link.
When the desired interaction occurs, that event appears in the Event Timeline.
So why did I say that the list of GTM events is endless? It’s because of the last type of trigger, called Custom.

A custom event is an event defined by you, your developer, or a 3rd party solution that is implemented on your website.
If you want to learn more about custom event tracking, take a look at the video below (but keep in mind that in this video, I was using the older version of the preview mode):
When you click any event in the timeline, you can see which tags fired and which ones didn’t. That’s where the Tags tab becomes super important.
Tags
This tab displays all available tags split into two groups: those that fired on the selected event and those that did not. What makes this section awesome is the ability to find out why a particular tag did or didn’t fire.
Choose any event in the Event Timeline and then click the tag you’re interested in.

What you’ll see is a much more detailed view of what happens with that tag:
- Properties of the tag.
- Triggers of the tag.
- Blocking triggers.

If you’re using more complex triggers with several conditions, you can see the status of each condition (take a look at the screenshot below). The green checkbox indicates that the condition was met. Otherwise, a red X appears.

Also, in the top-right corner of the preview mode (while you still have clicked the tag, you can switch between “Names” and “Values”. This will affect how variables are displayed in your tag.
If you choose Names, you will see their actual names, but if you want to see their values at that moment, switch to Values.

For me, switching to “Values” is more convenient. It allows me to quickly identify what values were sent to my analytics/marketing tools.

Also, you can quickly verify whether the values in your trigger match your requirements.

VERY IMPORTANT: Do not debug individual tags while having a Summary selected above the event timeline. This is an incorrect way to do it. Always select the event in the event stream first and only then click the tag to debug.
Variables
OK, let’s head over to the Variables tab. It displays detailed information about variables in the selected event, including the type of variable, the type of data returned, and the resolved value.

These variables are at your service. You can insert them in any tag or trigger you want (or even another variable), whether it’s a Google Analytics event tag, Mixpanel event tag, or anything else. Variables can be included by surrounding them with curly brackets {{ }}. Take a look at the example below.

Switch between GTM events (in the timeline), and you’ll see how the values of variables change depending on the context.
Data Layer
Data Layer tab is probably the most undervalued part of the GTM preview console among beginners (and quite often, among fresh intermediate users, too).
This tab shows the exact message object that was pushed to the data layer for the selected event and what the data layer looks like after the message transaction is complete.
In other words, you can see all data that is currently available in the data layer and what values were available after every Google Tag Manager event. The best part is that every data point (pushed to the data layer) can be turned into a variable in Google Tag Manager.
Even if you see some useful information in the Data Layer tab, you cannot use it in GTM until you create variables for them.
The variables tab (of the Google Tag Manager Debug pane) displays only those variables configured in the Google Tag Manager interface, e.g., Page Path, Page URL, etc. So, if you have something interesting in the data layer that you’d like to pass to Google Analytics, you’ll need to create a data layer variable in the GTM interface.
Say you want to send a Google Analytics event when someone leaves a comment. With every event, you also want to push the article author’s full name. This way, you’ll see which authors drive the highest reader engagement.
In the Google Tag Manager account, you should go to Variables and create a new one with the following settings (dlv stands for data layer variable):

After you refresh P&D mode AND your website in the browser window, you should see a new variable in the Variables tab with every new page load. Later on, you can include that {{dlv – Post Author}} variable in Google Analytics (or any other) tags.
In my other blog post, how to track AJAX forms with Google Tag Manager, I have explained how you can dive deeper into the data layer, pull nested values and turn them into GTM variables. That simple technique has already been useful so many times I can hardly imagine how I used to work without it.

Consent tab
This tab shows the consent status (e.g., denied or granted) if you have implemented Google Consent Mode.
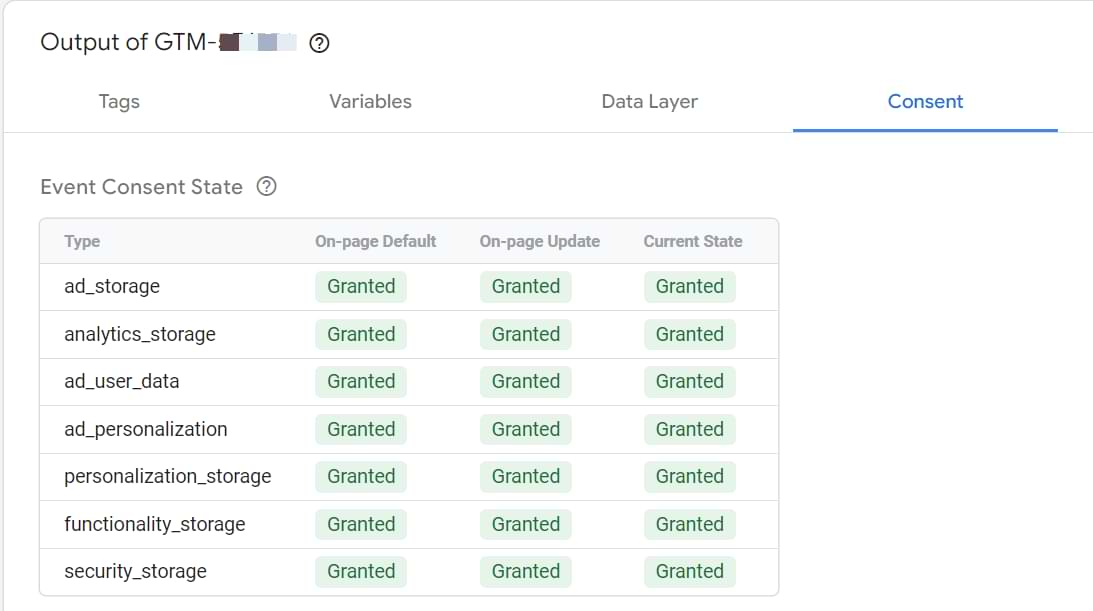
It can also display an error if a particular tag tries to read the consent status before the consent mode is actually set.
Errors tab
I don’t visit this tab very often (because not many tags actually throw errors that are displayed there). But if you notice any number in the tab (rather than 0), click it and see the cause. This tab displays if a GTM Tag Template failed to fire due to an error. Here’s a quick guide about it.

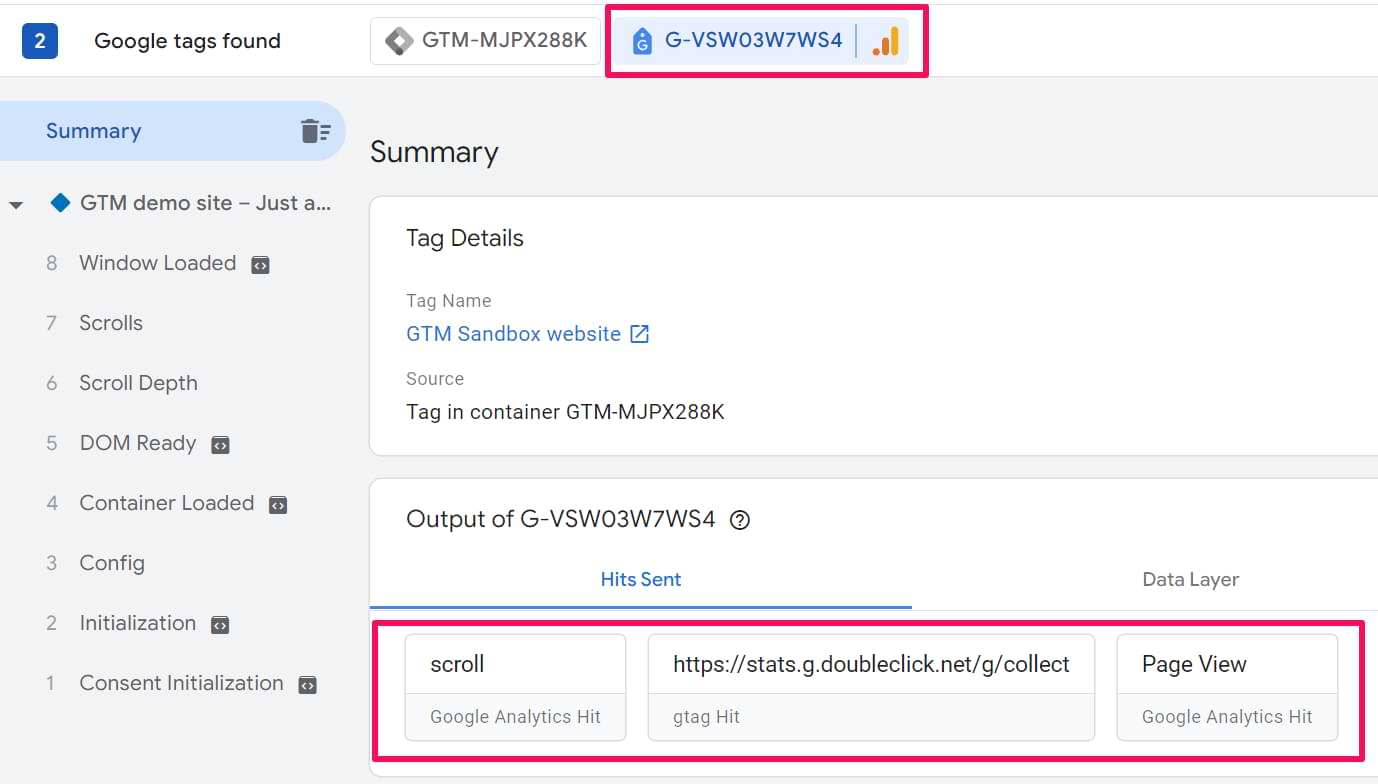
Header
The header displays the hostname of the website that you are currently debugging, the status (Connected or not), and also which Google tags have been found on that page (e.g., Google Tag Manager, GA4, Google ads, and so on).
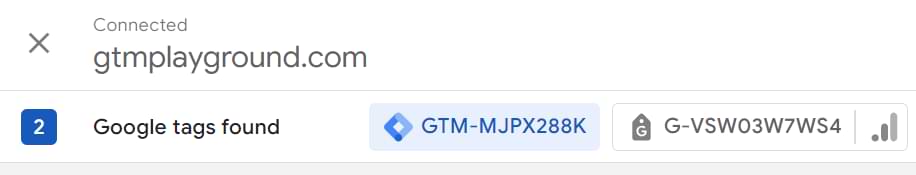
You can click on the tag ID (e.g., GA4 measurement ID) to see what data was sent to that property/platform.
If you don’t see the GTM container ID in that row, it means that GTM has not been installed properly on a website and you (or your developers) should check the setup.
If you select a non-GTM ID in that row, you will see what kind of requests were sent to that platform (e.g., Page view or scroll events). Click on those hits to see more details (the list of parameters included in the request).
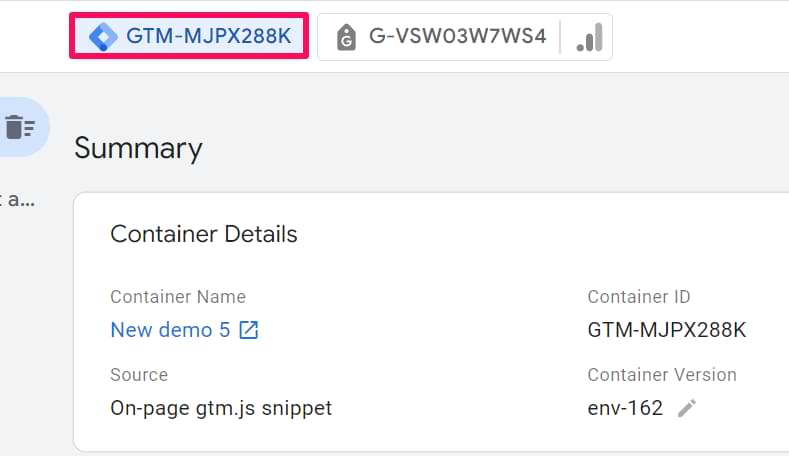
Container/Tag details
The content of this section depends on what kind of ID you have selected in the header.
In the case of a GTM container, you will see the container name, container ID, environment, how GTM was implemented, and the container version + environment. You can click the pencil icon to change the version/environment (which is convenient).
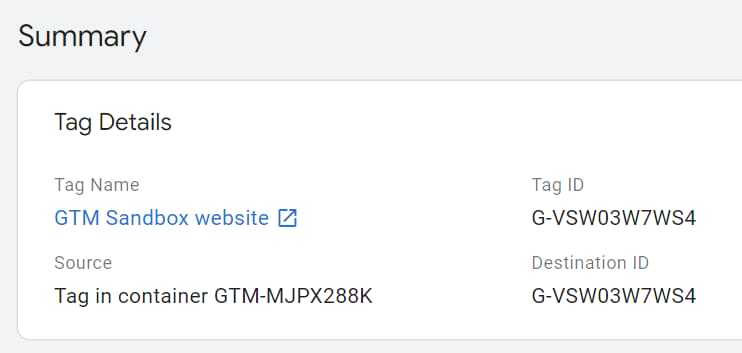
If you are troubleshooting GA4 implementation, the content will be slightly different:
Refresh the preview mode
If you make some changes in the container and you want to preview them on the website, you must refresh the preview mode.
To do that, you must go to the Google Tag Manager interface and press Preview again. Then complete the steps, and the preview mode will be reloaded.
Share GTM Preview mode
To share the preview mode with someone, first, you need to enable the preview mode yourself and then, in the top right corner, click three dots > Share.
Then a popup will appear where you will have to:
- Enter the link of the website where the preview mode should be enabled
- Select which container to enable (if there are multiple GTM Containers or GTAGs). IMPORTANT: you must select the GTM container in the dropdown


- Copy the link and share it with someone you wish
Another option is to click the X icon in the top left corner (while you are in the preview mode), then enable the Keep the domain…enabled for debugging checkbox and click Close debugger.

Then you will see the list of all preview modes that you have enabled. Next to the preview that you wish to share, click three dots, and then click Share.

After you click it, the aforementioned popup will appear.
If you have enabled the preview mode sometime in the past, just go to tagassistant.google.com and complete the same steps that I have described above.
Exit the preview mode
If you want to exit the preview mode, the best way is to click the Finish in the Preview mode’s badge (that is displayed at the bottom right corner of your website).

If that did not help and you continue seeing that badge on every pageview of the website, read this guide.
Debugging multiple domains (with the same container)
If you are working with multiple domains (that are part of the same customer journey) and those domains are using the same Google Tag Manager container, you will need to enable the preview mode on both domains.
First, open tagassistant.google.com (or just click the Preview button in the GTM Interface) and enter the domain of the 2nd website. Complete all the necessary steps to enable the preview mode.
Then (also on tagassistant.google.com) click the X icon in the top left corner + select Keep the domain XXXXX enabled for debugging. Click Close Debugger. That way, you’ll keep the 2nd website in the preview mode.
Then press either the Preview button in the GTM interface OR Add domain button in tagassistant.google.com and add the domain of the 1st website. Complete all the necessary steps until Website 1 is opened in a new tab or window.
What we have done here is that we set the _TAG_ASSISTANT=X first-party cookie on both domains (and this is needed for the preview mode to work). That’s why you can now navigate between both domains in the preview mode, and you’ll see all the events/data coming from both websites.
Debugging iFrames
The new preview mode also supports debugging iFrames. But there are more things related to this. Hence, I have published a separate blog post.
Enhancements with Tag Assistant Chrome Extension
Google’s naming can be confusing, so let’s be clear: there are two different tools named “Tag Assistant”.
- Tag Assistant (the website): This is the main Preview Mode interface, located at tagassistant.google.com. This is where the event timeline and debug console are displayed.
- Tag Assistant (the browser extension): This is an optional Chrome extension that improves the functionality of the main Preview Mode.
While the extension is not required, it is recommended. It helps the main preview tool connect to your website more reliably and offers several benefits.
With the extension installed, your website will be opened in a new tab (instead of a window) when you enable the preview mode. This means that you can use things like mobile debugging again.

Also, you will be able to debug multiple tabs at the same time.
Furthermore, some shapes appear in the event timeline and in the Preview mode’s badge (on your website). These are added to help you quickly distinguish which window is currently being debugged.
Common problems & solutions in preview mode
When debugging, you’ll often encounter the same issues. Here’s a quick table to help you diagnose and solve them.
|
Problem |
Likely cause |
Solution |
| A tag didn’t fire. | The trigger conditions were not met. | Click the tag on the relevant event in the timeline. Scroll down to the “Firing Triggers” section to see exactly which condition (marked with a red X) failed. |
| A variable shows as “undefined”. | The variable was not available in the Data Layer at the time the event occurred, or the Data Layer Variable name in GTM has a typo. | Click the “Data Layer” tab for the selected event and check the exact spelling and case of the key you are trying to access. Data Layer keys are case-sensitive. |
| I see a “Message” event in the timeline. | A dataLayer.push() occurred on the page without an “event” key. This is not an error but just an informational push of data. | This is expected behavior. You can click the “Data Layer” tab on that event to see what data was made available. |
| A “Link Click” event doesn’t appear when I click a link. | GTM’s link click listener is not active. | Make sure you have at least one “Just Links” trigger enabled in your container. |
| My GA4 tag fires, but no data appears in DebugView. | A browser extension, consent setting, or network filter is blocking the request to Google Analytics. | Check the “Network” tab in your browser’s developer tools for failed requests to google-analytics.com. Also, temporarily disable browser extensions that might block trackers. |
If Google Tag Manager Preview mode is not working
If you are struggling with the Preview and Debug mode (e.g., it is not displayed), read this troubleshooting guide. I will keep this blog post as updated as possible.
What is the ‘Message’ event in the timeline?
You may occasionally see a “Message” event appear in your event timeline, often before the “Container Loaded” event. You do not need to worry about this.
This simply means that a dataLayer.push() occurred on the page, but that push did not include an event key. When a push contains an event key (e.g., {‘event’: ‘login’}), GTM names the event in the timeline “login”.
When the event key is missing (e.g., {‘user_id’: ‘123’}), GTM still records that data was pushed, but it gives it the generic name “Message”. You can click on the “Message” event and inspect the Data Layer tab to see what information was pushed at that moment.
Few More Tips
Here are a few more quick tips that did not fit in any previous chapter of this blog post:
- If you see the “Message” event before the Page view event in Preview and Debug console’s Event Timeline, do not worry. This means that your developer, plugin, or particular 3rd party solution pushed some data into Data Layer but that dataLayer.push did not contain an “event” key. Use GTM debug mode to explore what exact data was pushed at that moment. Maybe you’ll find something useful!
- A whole bunch of other GTM debugging tips is available here.
Google Tag Manager Preview mode: Conclusion
Google Tag Manager Preview mode (a.k.a. Google Tag Manager debug mode or just simply Preview and Debug mode) is an essential part of tag deployment, which helps us ensure that every possible user experience scenario is tested and data consistency is validated.
It brings us more transparency to what’s happening under the hood, what data is being fetched or pushed, why a certain tag isn’t firing, etc.
However, it is important to understand that this is not the only place where you should check/test your tag management implementation. There are many more things you need to keep in mind.
Did I miss anything related to Google Tag Manager debug mode? If so, drop me a comment below.

15 COMMENTS
Hello,
I am in debug mode and my summary shows that a tag fired but the event action is blank. However, when I go to that specific gtm.click where the tag fired, it states the event action is filled in with the correct data. I am not sure which one I should trust more?
Don't check the summary for the debugging of an individual tag. That's not a good idea. Always choose an event in the left side of the preview and debug console and then check what happened with your tag.
Hello Julius
For some reason, I have 2 page-view events in my preview mode. One that triggers the GA - Pageview tag, fires first, but the other doesn't trigger any tags. The 2nd pageview usually appears after the DOM Ready event.
The two events displays different information in the datalayer
1st event - gtm.start:XXXXXX
2nd event - event:'Page view', content-name: '/home'
Which one would I want to send to GA? and how can I have two?
The 2nd page is custom and something on your website is doing that. Maybe a developer coded something additionally or maybe your Content Management System has some GTM plugin.
All in all: the first event is the real pageview, the 2nd one is created by some additional functionality on your website.
Sorry, but I'm now completely lost. I've enabled P&D mode and it doesn't work. Also, I can't use any type of Tag Injector extension anymore b/c of this update.
1. Read this guide to fix your preview mode https://www.analyticsmania.com/post/google-tag-manager-preview-mode-not-working/
2. The most common reason why injectors don't work is if you are trying to inject a container that was never published before (in other words - pretty new container). If this is not your case, then read other tips in the blog post.
Back to your dev and live websites. If they are on different domains BUT they are using the same container AND you are not using GTM environments, do the following:
- Enable GTM container for the dev website (by entering dev site's domain)
- And then enable the same GTM Container on the live website (by entering the live website's domain).
From now on, you need to enable the same container for every website individually (if multiple sites are using the same container)
We are noticing an issue where attempting to "preview" non-published workspaces within our staging environment causes no details to surface within the tag assistant console -- we do not have this issue on production and do have GTM environments configured. Thoughts?
If you want to preview environments, you must go to the list of your environments (in the admin), and initiate the preview from there.
Yes, understood there.
When we click Preview in an unpublished tag manager workspace we are trying to test and the new tag assistant beta tab opens and click start with our staging URL, tag assistant beta does show any data layer / tags / variable information on the left hand side.
Thanks again for your assistance
I have a site https://visabookings.com on which we implemented google tag manager but has impacted performance of the website. Looks like google tag manager takes some resources and cause delays. Is there any performance issue with google tag manager and how can we optimize?
Hi, just like any code added to a site, there will be impact on pagespeed. Learn more https://www.analyticsmania.com/post/google-tag-manager-impact-on-page-speed-and-how-to-improve/
Hi Julius and thanks for this very detailed article. I have a question for you : is there a way to check in preview mode, when GA4 starts recording a session and starts recording the 1st page view in a session ? I tried on real time report in GA4 but it's not easy to identify with other users at the same time.
Hey Julius, I'm pretty lost right now, because I couldn't find any information on my error and I hope you have an idea how to fix it.
I'm facing the issue, that whenever I do changes to an published GTM container (e.g. add a new tag or reactivate a paused tag) and then start the P&D mode, those changes are not picked up by the P&D mode.
So I can't check, if the new tag works.
Information in the P&D mode is only refreshed after I publish my GTM container. But that misses the whole point of testing unpublished changes via P&D mode or am I wrong?
Thanks in advance!
Sounds like your website is heavily cached (and that includes GTM). You should talk to the developers of the website, maybe they are using some caching plugin/tool and maybe it's possible for them to exclude caching of gtm.js
Hi Julius.
I have a website that has a certain feature i need to tag but is only available on mobile devices (not by screen size but by device type). when using gtm preview mode and going to dev tools i dont see the Device Emulation tool anywhere, i've tried shortcuts and different setting and is just not there. Do you know why? or how can i solve this? thank you!!